
Markets
Global markets along with US futures for the Dow Jones, S&P 500, NASDAQ and Russell 2000 were a sea of red on Thursday, after the Federal Reserve, on Wednesday, lowered expectations for economic growth over the rest of the year.
Treasuries advanced, the dollar’s rebound stalled—though at time of writing that appeared to be back on track, gold dropped, and oil slid.
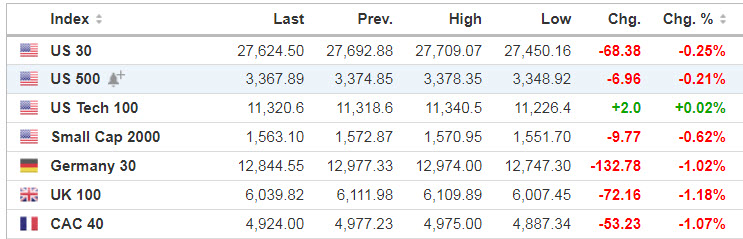
Source: SeekingAlpha.com
Economic Calendar
8:30 Initial Jobless Claims
8:30 Philly Fed Business Outlook
10:00 Leading Indicators
10:30 EIA Natural Gas Inventory
https://www.investing.com/economic-calendar/
***New: PTG Trading Room Chat Log’s Link
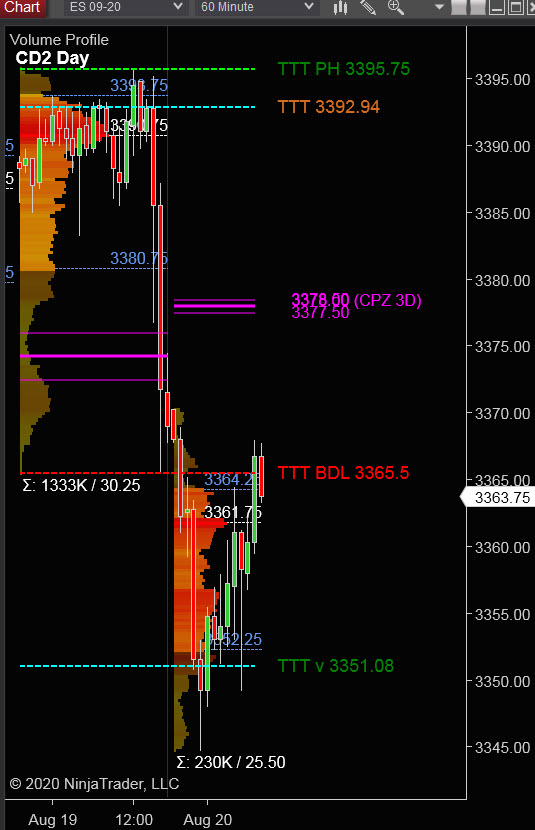
S&P 500
Prior Session was Cycle Day 1 (CD1): Normal CD1 as price put in late session low at 3365.50 CD1 Average Decline Objective. Range was 30.25 (10-day avg) handles on 1.333K contracts traded.
…Transition from Cycle Day 1 to Cycle Day 2
This leads us into Cycle Day 2 (CD2): Price has continued prior session decline pushing down to 3344.75 CD2 Range parameter, where it found buyers and has since bounced back to 3365.50 CD1 Low. Price is below prior Value Zone so today we have two scenarios to consider for today’s trading.
1.) Price sustains a bid above 3365, initially targeting 3375 – 3380 zone.
2.) Price sustains an offer below 3365, initially targeting 3355 – 3350 zone.
*****3 Day Cycle has a 91% probability of fulfilling Positive Statistic covering 12 years of recorded tracking history.
PVA High Edge = 3394 PVA Low Edge = 3380 Prior POC = 3390
Range Projections and Key Levels (ES) September 2020 (U) Contract
HOD ATR Range Projection: 3395; LOD ATR Range Projection: 3365; 3 Day Central Pivot: 3378; 3 Day Cycle Target: 3398; 10 Day Average True Range 30; VIX: 23.65
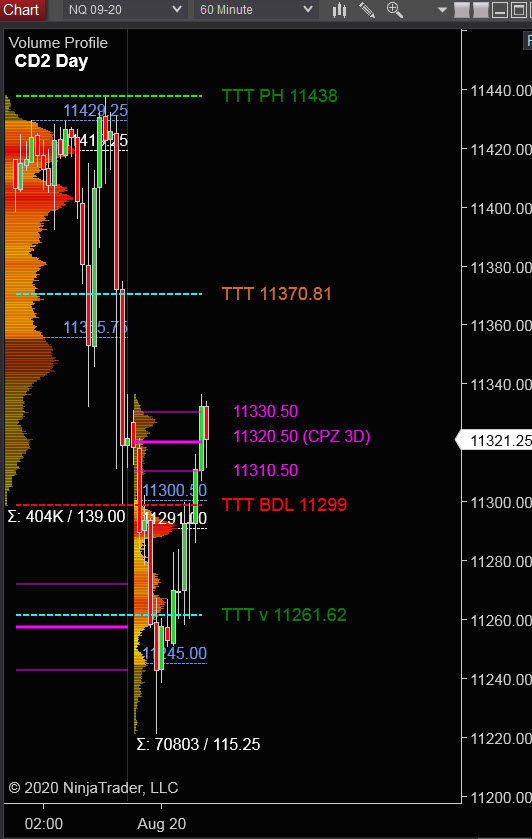
Nasdaq 100 (NQ)
Today is Cycle Day 2 (CD2)…Price has recovered overnight losses and is trading back above 11299 CD1 Low. Range was 139 handles on 404K contracts traded. Price is below prior Value Zone so today we have two scenarios to consider:
PVA High Edge = 11430 PVA Low Edge = 11355 Prior POC = 11420
Bull Scenario: IF Bulls sustain a bid above 11300, THEN initial upside estimate targets 11320 – 11330 3 Day Central Pivot Zone.
Bear Scenario: IF Bears sustain an offer below 11300, THEN initial downside estimate targets 11265 – 11245 zone.
Range Projections and Key Levels (NQ) September 2020 (U) Contract
HOD ATR Range Projection: 11480; LOD ATR Range Projection: 11258; 3 Day Central Pivot: 11320; 3 Day Cycle Target: 11385; 10 Day Average True Range: 180; VIX: 23.65
Trade Strategy: Our tactical trade strategy will simply remain unaltered…We’ll be flexible to trade both long and short side from Decision Pivot Levels. Continue to focus on Bull/Bear Stackers and Premium/Discounts. As always, remaining in alignment with dominant intra-day force increases probabilities of producing winning trades.
Stay Focused…Non-Biased…Disciplined ALWAYS USE STOPS!
Good Trading…David
“Knowing is not enough, We must APPLY. Willing is not enough, We must DO.” –Bruce Lee
*****This trade strategy report is disseminated for “education only” and should not be viewed in any way as a recommendation to buy or sell futures products.”
PAST PERFORMANCE IS NOT NECESSARILY INDICATIVE OF FUTURE RESULTS
IMPORTANT NOTICE! No representation is being made that the use of this strategy or any system or trading methodology will generate profits. Past performance is not necessarily indicative of future results. There is substantial risk of loss associated with trading securities and options on equities. Only risk capital should be used to trade. Trading securities is not suitable for everyone.
Disclaimer: Futures, Options, and Currency trading all have large potential rewards, but they also have large potential risk. You must be aware of the risks and be willing to accept them in order to invest in these markets. Don’t trade with money you can’t afford to lose.
This website is neither a solicitation nor an offer to Buy/Sell futures, options, or currencies. No representation is being made that any account will or is likely to achieve profits or losses similar to those discussed on this web site. The past performance of any trading system or methodology is not necessarily indicative of future results.
CFTC RULE 4.41 –HYPOTHETICAL OR SIMULATED PERFORMANCE RESULTS HAVE CERTAIN LIMITATIONS. UNLIKE AN ACTUAL PERFORMANCE RECORD, SIMULATED RESULTS DO NOT REPRESENT ACTUAL TRADING. ALSO, SINCE THE TRADES HAVE NOT BEEN EXECUTED, THE RESULTS MAY HAVE UNDER-OR-OVER COMPENSATED FOR THE IMPACT, IF ANY, OF CERTAIN MARKET FACTORS, SUCH AS LACK OF LIQUIDITY. SIMULATED TRADING PROGRAMS IN GENERAL ARE ALSO SUBJECT TO THE FACT THAT THEY ARE DESIGNED WITH THE BENEFIT OF HINDSIGHT. NO REPRESENTATION IS BEING MADE THAT ANY ACCOUNT WILL OR IS LIKELY TO ACHIEVE PROFIT OR LOSSES SIMILAR TO THOSE SHOWN