
Markets
Party goes on
Prince – 1999
The mother of all crashes? No bubble at all? Fed taper concerns and the spread of the Delta variant don’t seem to be able to weigh on sentiment for more than a day
@CL at lowest since May as taper talk adds to demand fears.
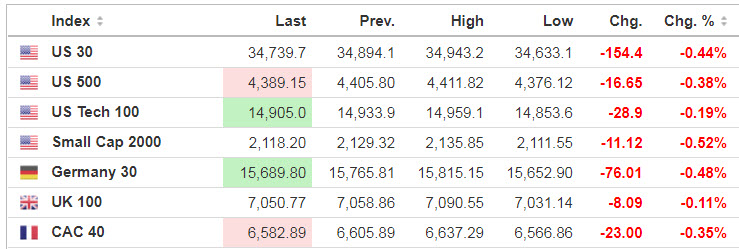
Overnight, Dow and S&P futures slipped 0.5%, while contracts linked to the Nasdaq fell back 0.4%.
Source: SeekingAlpha.com
Economic Calendar
1:00 PM Baker-Hughes Rig Count
***New: PTG Trading Room Chat Log’s Link
S&P 500

Prior Session was Cycle Day 2 (CD2): Price found strong buy response from the CD2 Violation Level (4350) reversing early weakness, recovering back above CD1 Low (4381.50). Range was 67 handles on 1.895M contracts exchanged.
…Transition from Cycle Day 2 to Cycle Day 3
This leads us into Cycle Day 3 (CD3): 3 Day Cycle Statistic is in-place as long as price trades above CD1 Low (4381.50) during today’s day session. As such, estimated scenarios to consider for today’s trading.
1.) Price sustains a bid above 4382, initially targets 4410 – 4415 zone.
2.) Price sustains an offer below 4382, initially targets 4370 – 4355 zone.
*****3 Day Cycle has a 91% probability of fulfilling Positive Cycle Statistics covering 12 years of recorded tracking history.
PVA High Edge = 4413 PVA Low Edge = 4384 Prior POC = 4397
Range Projections and Key Levels (ES) Sept 2021 (U) Contract
HOD ATR Range Projection: 4402; LOD ATR Range Projection: 4367; 3 Day Central Pivot: 4412; 3 Day Cycle Target: 4415; 10 Day Average True Range 30; VIX: 23

Nasdaq 100 (NQ)

Today is Cycle Day 3 (CD3)…Nasdaq futures has fulfilled 3 Day Cycle Statistic. Prior range was 289 handles on 721k contracts exchanged. As such, there are two estimated scenarios to consider for today’s trading.
PVA High Edge = 14992 PVA Low Edge = 14832 Prior POC = 14965
Bull Scenario: IF Bulls sustain a bid above 14855, THEN initial upside estimate targets 14935 – 14955 zone.
Bear Scenario: IF Bears sustain an offer below 14855, THEN initial downside estimate targets 14805 – 14775 zone.
Range Projections and Key Levels (NQ) Sept 2021 (U) Contract
HOD ATR Range Projection: 15014; LOD ATR Range Projection: 14795; 3 Day Central Pivot: 14925; 3 Day Cycle Target: 14906; 10 Day Average True Range: 162; VIX: 23

Trade Strategy: Our tactical trade strategy will simply remain unaltered…We’ll be flexible to trade both long and short side from Decision Pivot Levels. Continue to focus on Bull/Bear Stackers and Premium/Discounts. As always, remaining in alignment with dominant intra-day force increases probabilities of producing winning trades.
Stay Focused…Non-Biased…Disciplined ALWAYS USE STOPS!
Good Trading…David
“Knowing is not enough, We must APPLY. Willing is not enough, We must DO.” –Bruce Lee
*****This trade strategy report is disseminated for “education only” and should not be viewed in any way as a recommendation to buy or sell futures products.”
PAST PERFORMANCE IS NOT NECESSARILY INDICATIVE OF FUTURE RESULTS
IMPORTANT NOTICE! No representation is being made that the use of this strategy or any system or trading methodology will generate profits. Past performance is not necessarily indicative of future results. There is substantial risk of loss associated with trading securities and options on equities. Only risk capital should be used to trade. Trading securities is not suitable for everyone.
Disclaimer: Futures, Options, and Currency trading all have large potential rewards, but they also have large potential risk. You must be aware of the risks and be willing to accept them in order to invest in these markets. Don’t trade with money you can’t afford to lose.
This website is neither a solicitation nor an offer to Buy/Sell futures, options, or currencies. No representation is being made that any account will or is likely to achieve profits or losses similar to those discussed on this web site. The past performance of any trading system or methodology is not necessarily indicative of future results.
CFTC RULE 4.41 –HYPOTHETICAL OR SIMULATED PERFORMANCE RESULTS HAVE CERTAIN LIMITATIONS. UNLIKE AN ACTUAL PERFORMANCE RECORD, SIMULATED RESULTS DO NOT REPRESENT ACTUAL TRADING. ALSO, SINCE THE TRADES HAVE NOT BEEN EXECUTED, THE RESULTS MAY HAVE UNDER-OR-OVER COMPENSATED FOR THE IMPACT, IF ANY, OF CERTAIN MARKET FACTORS, SUCH AS LACK OF LIQUIDITY. SIMULATED TRADING PROGRAMS IN GENERAL ARE ALSO SUBJECT TO THE FACT THAT THEY ARE DESIGNED WITH THE BENEFIT OF HINDSIGHT. NO REPRESENTATION IS BEING MADE THAT ANY ACCOUNT WILL OR IS LIKELY TO ACHIEVE PROFIT OR LOSSES SIMILAR TO THOSE SHOWN