
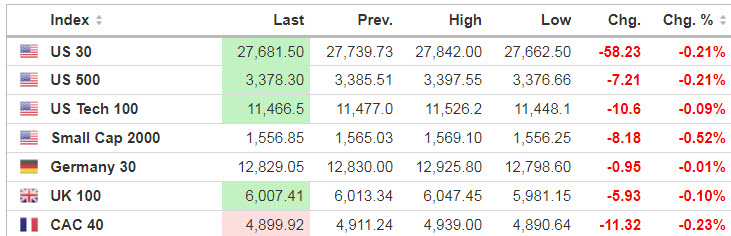
Markets
U.S. stock futures are pointing slightly lower, two days removed from the S&P 500 Index carving out a new record high. Oil prices are down slightly amid efforts by major oil producers to hold back output. In early action, WTI crude oil futures -0.75% to $42.50/bbl
Source: SeekingAlpha.com
Economic Calendar
9:45 PMI Composite Flash
10:00 Existing Home Sales
1:00 PM Baker-Hughes Rig Count
Existing home sales expected to show some pop
The existing home sales report is due out today, with a consensus forecast for 5.38M home sales in July vs. 4.72M in June. Bank of America expects a mark of 5.40M.
https://www.investing.com/economic-calendar/
***New: PTG Trading Room Chat Log’s Link
S&P 500
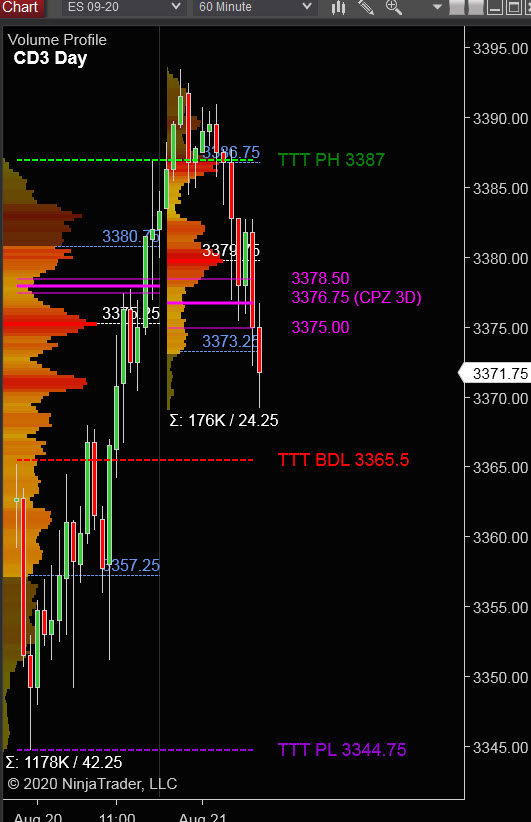
Prior Session was Cycle Day 2 (CD2): Price continued its rally fulfilling 3 Day Cycle Statistic. Range was 42.25 handles on 1.178K contracts traded.
…Transition from Cycle Day 2 to Cycle Day 3
This leads us into Cycle Day 3 (CD3): Price is trading lower back to mid-value pre-RTH as monthly and weekly options expire. Price is trading back within prior value zone, and as such, there are two scenarios to consider for today’s trading.
1.) Price sustains a bid above 3375, initially targeting 3385 – 3390 zone.
2.) Price sustains an offer below 3375, initially targeting 3360 – 3355 zone.
*****3 Day Cycle has a 91% probability of fulfilling Positive Statistic covering 12 years of recorded tracking history.
PVA High Edge = 3380 PVA Low Edge = 3360 Prior POC = 3375
Range Projections and Key Levels (ES) September 2020 (U) Contract
HOD ATR Range Projection: 3375; LOD ATR Range Projection: 3356; 3 Day Central Pivot: 3375; 3 Day Cycle Target: 3398; 10 Day Average True Range 31; VIX: 23.34
Nasdaq 100 (NQ)
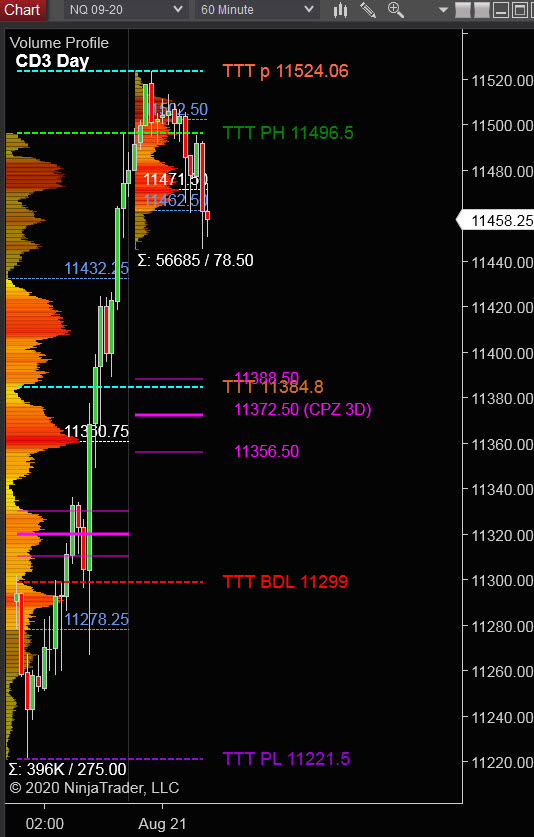
Today is Cycle Day 3 (CD3)…Price is trading of its all-time high and has fulfilled Positive 3 Day Cycle Statistic. Pre-RTH price is trading above prior value zone and as such, there are two scenarios to consider:
PVA High Edge = 11432 PVA Low Edge = 11278 Prior POC = 11360
Bull Scenario: IF Bulls sustain a bid above 11470, THEN initial upside estimate targets 11495 – 11515 zone.
Bear Scenario: IF Bears sustain an offer below 11470, THEN initial downside estimate targets 11430 – 11400 zone.
Range Projections and Key Levels (NQ) September 2020 (U) Contract
HOD ATR Range Projection: 11410; LOD ATR Range Projection: 11308; 3 Day Central Pivot: 11372; 3 Day Cycle Target: 11525; 10 Day Average True Range: 188; VIX: 23.34
Trade Strategy: Our tactical trade strategy will simply remain unaltered…We’ll be flexible to trade both long and short side from Decision Pivot Levels. Continue to focus on Bull/Bear Stackers and Premium/Discounts. As always, remaining in alignment with dominant intra-day force increases probabilities of producing winning trades.
Stay Focused…Non-Biased…Disciplined ALWAYS USE STOPS!
Good Trading…David
“Knowing is not enough, We must APPLY. Willing is not enough, We must DO.” –Bruce Lee
*****This trade strategy report is disseminated for “education only” and should not be viewed in any way as a recommendation to buy or sell futures products.”
PAST PERFORMANCE IS NOT NECESSARILY INDICATIVE OF FUTURE RESULTS
IMPORTANT NOTICE! No representation is being made that the use of this strategy or any system or trading methodology will generate profits. Past performance is not necessarily indicative of future results. There is substantial risk of loss associated with trading securities and options on equities. Only risk capital should be used to trade. Trading securities is not suitable for everyone.
Disclaimer: Futures, Options, and Currency trading all have large potential rewards, but they also have large potential risk. You must be aware of the risks and be willing to accept them in order to invest in these markets. Don’t trade with money you can’t afford to lose.
This website is neither a solicitation nor an offer to Buy/Sell futures, options, or currencies. No representation is being made that any account will or is likely to achieve profits or losses similar to those discussed on this web site. The past performance of any trading system or methodology is not necessarily indicative of future results.
CFTC RULE 4.41 –HYPOTHETICAL OR SIMULATED PERFORMANCE RESULTS HAVE CERTAIN LIMITATIONS. UNLIKE AN ACTUAL PERFORMANCE RECORD, SIMULATED RESULTS DO NOT REPRESENT ACTUAL TRADING. ALSO, SINCE THE TRADES HAVE NOT BEEN EXECUTED, THE RESULTS MAY HAVE UNDER-OR-OVER COMPENSATED FOR THE IMPACT, IF ANY, OF CERTAIN MARKET FACTORS, SUCH AS LACK OF LIQUIDITY. SIMULATED TRADING PROGRAMS IN GENERAL ARE ALSO SUBJECT TO THE FACT THAT THEY ARE DESIGNED WITH THE BENEFIT OF HINDSIGHT. NO REPRESENTATION IS BEING MADE THAT ANY ACCOUNT WILL OR IS LIKELY TO ACHIEVE PROFIT OR LOSSES SIMILAR TO THOSE SHOWN