
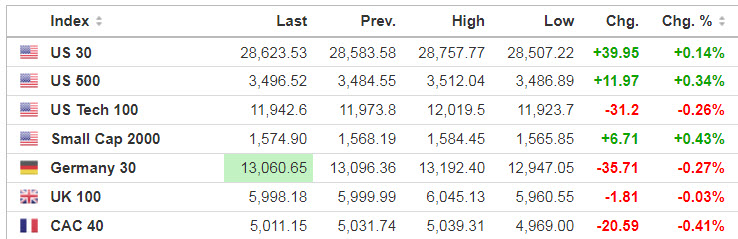
Markets
Dow and S&P 500 futures are up 0.5% and 0.4%, respectively, while Nasdaq futures are hugging the flatline.
Source: SeekingAlpha.com
Economic Calendar
8:30 International Trade in Goods (Advance)
8:30 Retail Inventories (Advance)
8:30 Wholesale Inventories (Advance)
8:30 Personal Income and Outlays
9:45 Chicago PMI
10:00 Consumer Sentiment
1:00 PM Baker-Hughes Rig Count
https://www.investing.com/economic-calendar/
***New: PTG Trading Room Chat Log’s Link
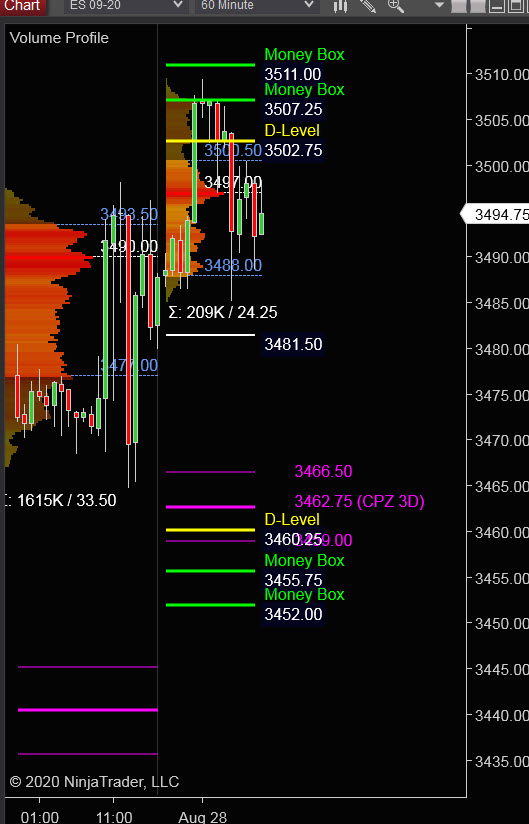
S&P 500
Prior Session was Cycle Day 1 (CD1): Price extended gains early in the session, then settled back during the afternoon. Market on Close Buy Imbalance of $1.6B kept firm bid. Range was 33.00 handles, above the 10-day average (26) on 1.615K contracts traded.
…Transition from Cycle Day 1 to Cycle Day 2
This leads us into Cycle Day 2 (CD2): Price has marginally extended gains above prior high and has since pulled back within prior range. Normal expectation for CD2 is for some ‘back n fill’ consolidation . Price is within prior Value Zone, so there are two scenarios to consider for today’s trading.
1.) Price sustains a bid above 3485, initially targeting 3507 – 3511 zone.
2.) Price sustains an offer below 3485, initially targeting 3470 – 3465 zone.
*****3 Day Cycle has a 91% probability of fulfilling Positive Statistic covering 12 years of recorded tracking history.
PVA High Edge = 3494 PVA Low Edge = 3477 Prior POC = 3490
Range Projections and Key Levels (ES) September 2020 (U) Contract
HOD ATR Range Projection: 3492; LOD ATR Range Projection: 3472; 3 Day Central Pivot: 3463; 3 Day Cycle Target: 3523; 10 Day Average True Range 26; VIX: 25.00
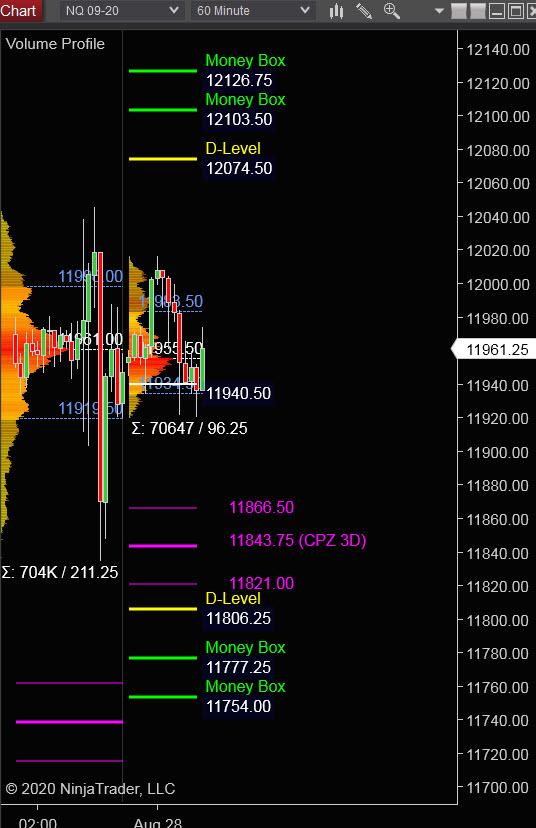
Nasdaq 100 (NQ)
Today is Cycle Day 2 (CD2)…Prior Session’s range was 211.25 handles on 704K contracts traded. Price is within prior Value Zone so today we have two scenarios to consider:
PVA High Edge = 11998 PVA Low Edge = 11920 Prior POC = 11962
Bull Scenario: IF Bulls sustain a bid above 11960, THEN initial upside estimate targets 11990 – 12000 zone.
Bear Scenario: IF Bears sustain an offer below 11960, THEN initial downside estimate targets 11940 – 11920 zone.
Range Projections and Key Levels (NQ) September 2020 (U) Contract
HOD ATR Range Projection: 11997; LOD ATR Range Projection: 11884; 3 Day Central Pivot: 11844; 3 Day Cycle Target: 12100; 10 Day Average True Range: 162; VIX: 25.00
Trade Strategy: Our tactical trade strategy will simply remain unaltered…We’ll be flexible to trade both long and short side from Decision Pivot Levels. Continue to focus on Bull/Bear Stackers and Premium/Discounts. As always, remaining in alignment with dominant intra-day force increases probabilities of producing winning trades.
Stay Focused…Non-Biased…Disciplined ALWAYS USE STOPS!
Good Trading…David
“Knowing is not enough, We must APPLY. Willing is not enough, We must DO.” –Bruce Lee
*****This trade strategy report is disseminated for “education only” and should not be viewed in any way as a recommendation to buy or sell futures products.”
PAST PERFORMANCE IS NOT NECESSARILY INDICATIVE OF FUTURE RESULTS
IMPORTANT NOTICE! No representation is being made that the use of this strategy or any system or trading methodology will generate profits. Past performance is not necessarily indicative of future results. There is substantial risk of loss associated with trading securities and options on equities. Only risk capital should be used to trade. Trading securities is not suitable for everyone.
Disclaimer: Futures, Options, and Currency trading all have large potential rewards, but they also have large potential risk. You must be aware of the risks and be willing to accept them in order to invest in these markets. Don’t trade with money you can’t afford to lose.
This website is neither a solicitation nor an offer to Buy/Sell futures, options, or currencies. No representation is being made that any account will or is likely to achieve profits or losses similar to those discussed on this web site. The past performance of any trading system or methodology is not necessarily indicative of future results.
CFTC RULE 4.41 –HYPOTHETICAL OR SIMULATED PERFORMANCE RESULTS HAVE CERTAIN LIMITATIONS. UNLIKE AN ACTUAL PERFORMANCE RECORD, SIMULATED RESULTS DO NOT REPRESENT ACTUAL TRADING. ALSO, SINCE THE TRADES HAVE NOT BEEN EXECUTED, THE RESULTS MAY HAVE UNDER-OR-OVER COMPENSATED FOR THE IMPACT, IF ANY, OF CERTAIN MARKET FACTORS, SUCH AS LACK OF LIQUIDITY. SIMULATED TRADING PROGRAMS IN GENERAL ARE ALSO SUBJECT TO THE FACT THAT THEY ARE DESIGNED WITH THE BENEFIT OF HINDSIGHT. NO REPRESENTATION IS BEING MADE THAT ANY ACCOUNT WILL OR IS LIKELY TO ACHIEVE PROFIT OR LOSSES SIMILAR TO THOSE SHOWN