
Markets
Markets are getting some more relief as the PBOC set its official midpoint reference for the yuan at 6.9996 on Wednesday, weaker than the 6.9683 set Tuesday but still stronger than the key 7 per dollar level. Dow and S&P 500 futures are up 0.4% on the news, while the Nasdaq points to a rise of 0.7%
In Asia, Japan -0.3%. Hong Kong +0.1%. China -0.3%. India -0.8%.
In Europe, at midday, London +0.9%. Paris +1.4%. Frankfurt +1.5%.
Futures at 6:20, Dow +0.4%. S&P +0.4%. Nasdaq +0.7%. Crude -0.4% to $53.43. Gold +1% to $1499.10. Bitcoin -5% to $11619.
Ten-year Treasury Yield -6 bps to 1.68%
Source: Seeking Alpha https://seekingalpha.com/
Economic Calendar: https://www.investing.com/economic-calendar/
7:00MBA Mortgage Applications
9:30Fed’s Evans Speech
10:30EIA Petroleum Inventories
1:00 PMResults of $27B, 10-Year Note Auction
3:00 PMConsumer Credit
***New: PTG Trading Room Chat Log’s Link
S&P 500
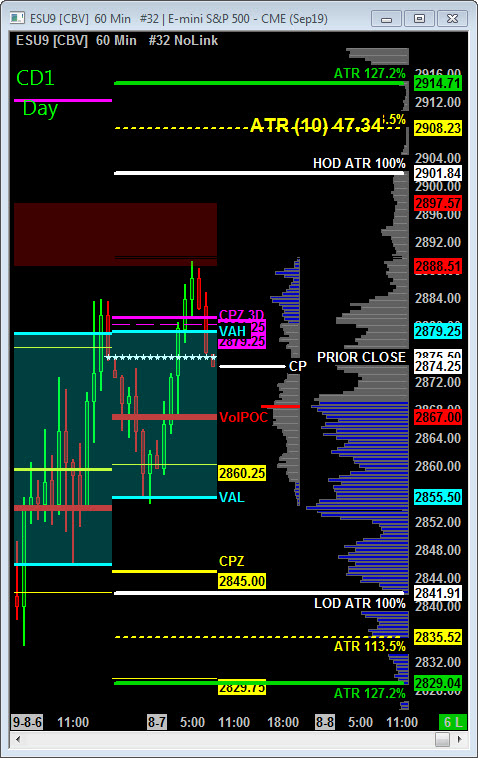
Today is Cycle Day 1 (CD1)…Normal is for a decline measuring 2850.00. Average Range for CD1 is 31.50 handles. Odds of decline > 10 handles = 73% Odds of decline > 20 = 43%
CD1 Range High = 2886 CD1 Range Low = 2858 CD1 Range Avg = 31.50
Scenario 1: IF Bulls hold bid above 2875, THEN initial upside targets 2886 – 2893 zone.
Scenario 2: IF Bears hold offer below 2875, THEN initial downside targets 2868 – 2860 zone.
Range Projections and Key Levels (ES) September 2019 (U) Contract
HOD ATR Range Projection: 2902.00; LOD ATR Range Projection: 2842.00; 3 Day Central Pivot: 2880.00; 3 Day Cycle Target: 2895.00; 10 Day Average True Range 47.34; VIX: 20.00
Nasdaq 100 (NQ)
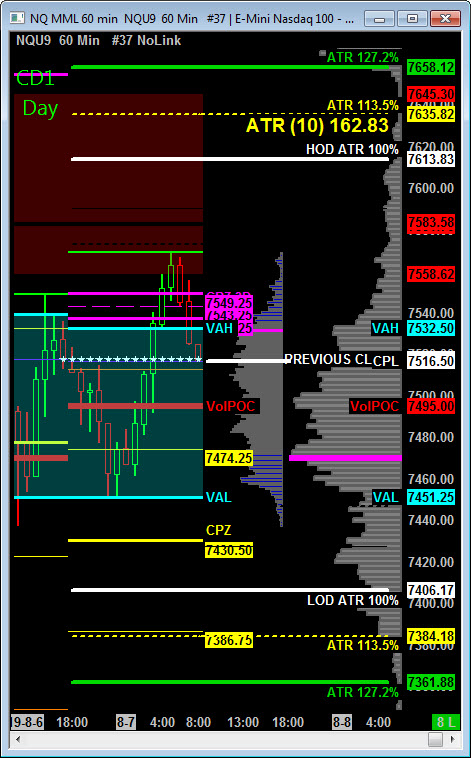
Today is Cycle Day 1 (CD1)…Normal is for a decline measuring 7427.00. Average Range for CD1 is 117.00 handles. Odds of decline > 20 handles = 74% Odds of decline > 25 = 66%
CD1 Range High =7568 CD1 Range Low = 7452 CD1 Range Avg = 117.00
Scenario 1: IF Bulls hold bid above 7518, THEN initial upside targets 7550 – 7568 zone.
Scenario 2: IF Bears hold offer below 7518, THEN initial downside targets 7495 – 7474 zone.
Range Projections and Key Levels (NQ) September 2019 (U) Contract
HOD ATR Range Projection: 7614.00; LOD ATR Range Projection: 7406.00; 3 Day Central Pivot: 7544.00; 3 Day Cycle Target: 7598.00; 10 Day Average True Range: 162.83; VIX: 20.00
Trade Strategy: Our tactical trade strategy will simply remain unaltered…We’ll be flexible to trade both long and short side from Decision Pivot Levels. Continue to focus on Bull/Bear Stackers and Premium/Discounts. As always, remaining in alignment with dominant intra-day force increases probabilities of producing winning trades.
Stay Focused…Non-Biased…Disciplined ALWAYS USE STOPS!
Good Trading…David
“Knowing is not enough, We must APPLY. Willing is not enough, We must DO.” –Bruce Lee
*****This trade strategy report is disseminated for “education only” and should not be viewed in any way as a recommendation to buy or sell futures products.”
PAST PERFORMANCE IS NOT NECESSARILY INDICATIVE OF FUTURE RESULTS
IMPORTANT NOTICE! No representation is being made that the use of this strategy or any system or trading methodology will generate profits. Past performance is not necessarily indicative of future results. There is substantial risk of loss associated with trading securities and options on equities. Only risk capital should be used to trade. Trading securities is not suitable for everyone.
Disclaimer: Futures, Options, and Currency trading all have large potential rewards, but they also have large potential risk. You must be aware of the risks and be willing to accept them in order to invest in these markets. Don’t trade with money you can’t afford to lose.
This website is neither a solicitation nor an offer to Buy/Sell futures, options, or currencies. No representation is being made that any account will or is likely to achieve profits or losses similar to those discussed on this web site. The past performance of any trading system or methodology is not necessarily indicative of future results.
CFTC RULE 4.41 –HYPOTHETICAL OR SIMULATED PERFORMANCE RESULTS HAVE CERTAIN LIMITATIONS. UNLIKE AN ACTUAL PERFORMANCE RECORD, SIMULATED RESULTS DO NOT REPRESENT ACTUAL TRADING. ALSO, SINCE THE TRADES HAVE NOT BEEN EXECUTED, THE RESULTS MAY HAVE UNDER-OR-OVER COMPENSATED FOR THE IMPACT, IF ANY, OF CERTAIN MARKET FACTORS, SUCH AS LACK OF LIQUIDITY. SIMULATED TRADING PROGRAMS IN GENERAL ARE ALSO SUBJECT TO THE FACT THAT THEY ARE DESIGNED WITH THE BENEFIT OF HINDSIGHT. NO REPRESENTATION IS BEING MADE THAT ANY ACCOUNT WILL OR IS LIKELY TO ACHIEVE PROFIT OR LOSSES SIMILAR TO THOSE SHOWN