

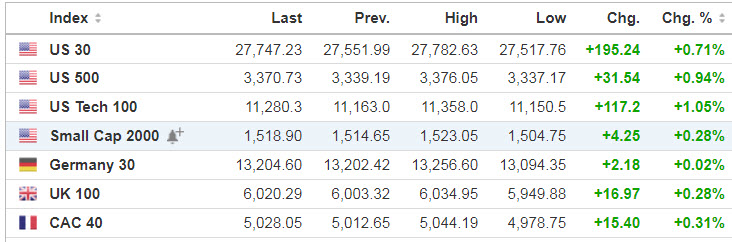
Markets
Futures are trading higher once again, with the Dow up 216 points and S&P 500 and Nasdaq ahead by 1% and 1.4%, respectively, following a volatile session on Thursday that saw the recent tech selloff resume. Market liquidity remains thin, and this can leave stocks vulnerable to exaggerated moves around big options trades, according to JPMorgan Chase & Co.
Source: SeekingAlpha.com
Economic Calendar
8:30 Consumer Price Index
10:00 Quarterly Services Report
1:00 PM Baker-Hughes Rig Count
2:00 PM Treasury Budget
https://www.investing.com/economic-calendar/
***New: PTG Trading Room Chat Log’s Link
S&P 500
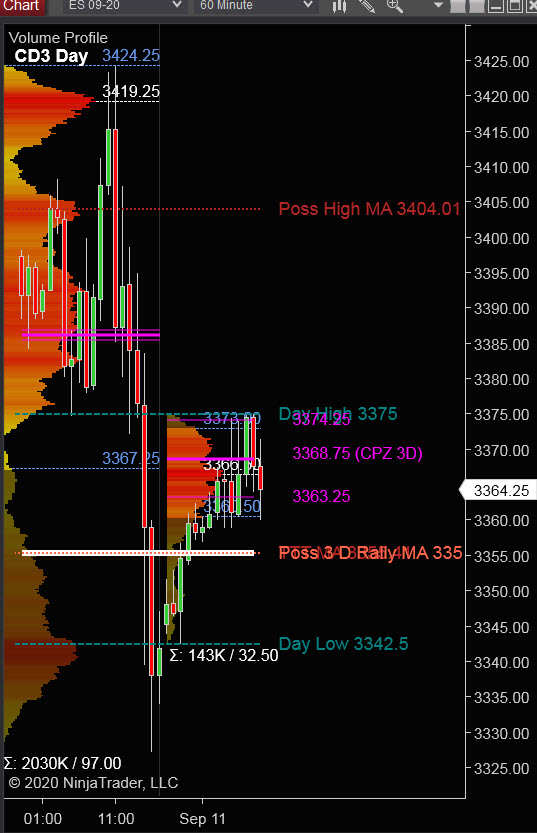
Prior Session was Cycle Day 2 (CD2): Early normal CD2 consolidation which failed to expand above CD1 High lead to a sharp selloff late morning which carried price below CD1 Low (3355.25) for RTH Session. Price will need to recover this level to secure a Positive 3 Day Cycle Statistic. Range was 97 handles, with 2.0M contracts exchanged.
…Transition from Cycle Day 2 to Cycle Day 3
This leads us into Cycle Day 3 (CD3): Price has recovered back above CD1 Low (3355.25) but stalling within 3 Day Central Pivot Zone (3374.25 – 3363.25) pre-RTH. We’ll mark today as a “wild-card” day with plenty of volatility to move price sharply in either direction. There are two scenarios to consider for today’s trading.
1.) Price sustains a bid above 3368, initially targeting 3378 – 3388 zone.
2.) Price sustains an offer below 3368, initially targeting 3350 – 3340 zone.
*****3 Day Cycle has a 91% probability of fulfilling Positive Statistic covering 12 years of recorded tracking history.
PVA High Edge = 3424 PVA Low Edge = 3368 Prior POC = 3419
Range Projections and Key Levels (ES) September 2020 (U) Contract
HOD ATR Range Projection: 3384; LOD ATR Range Projection: 3345; 3 Day Central Pivot: 3368; 3 Day Cycle Target: 3352; 10 Day Average True Range 67; VIX: 28
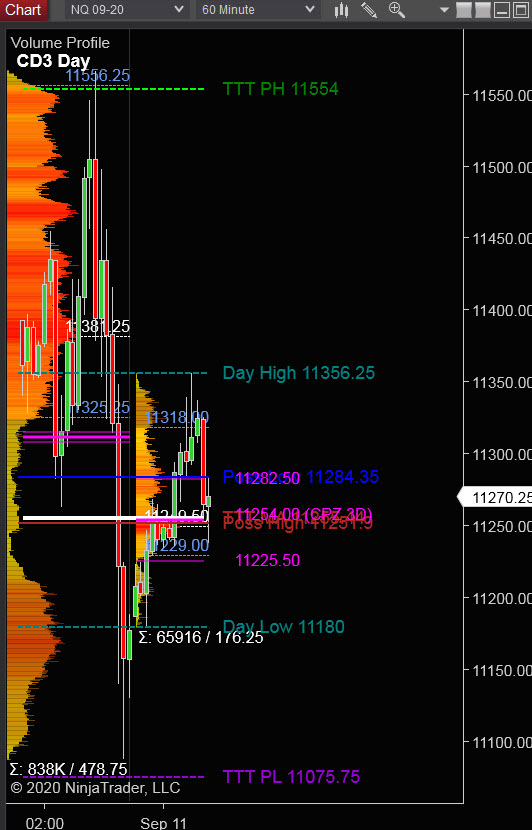
Nasdaq 100 (NQ)
Today is Cycle Day 3 (CD3)…Price has recovered partial losses inflicted during prior session, trading within 3 Day Central Pivot Zone (11282 – 11225). Positive 3 day cycle statistic has been fulfilled and as such, there are two scenarios to consider for today’s trading:
PVA High Edge = 11404 PVA Low Edge = 11488 Prior POC = 11458
Bull Scenario: IF Bulls sustain a bid above 11250, THEN initial upside estimate targets 11350 – 11370 zone.
Bear Scenario: IF Bears sustain an offer below 11250, THEN initial downside estimate targets 11200 – 11150 zone.
Range Projections and Key Levels (NQ) September 2020 (U) Contract
HOD ATR Range Projection: 11417; LOD ATR Range Projection: 11213; 3 Day Central Pivot: 11250; 3 Day Cycle Target: 11250; 10 Day Average True Range: 342; VIX: 28
Trade Strategy: Our tactical trade strategy will simply remain unaltered…We’ll be flexible to trade both long and short side from Decision Pivot Levels. Continue to focus on Bull/Bear Stackers and Premium/Discounts. As always, remaining in alignment with dominant intra-day force increases probabilities of producing winning trades.
Stay Focused…Non-Biased…Disciplined ALWAYS USE STOPS!
Good Trading…David
“Knowing is not enough, We must APPLY. Willing is not enough, We must DO.” –Bruce Lee
*****This trade strategy report is disseminated for “education only” and should not be viewed in any way as a recommendation to buy or sell futures products.”
PAST PERFORMANCE IS NOT NECESSARILY INDICATIVE OF FUTURE RESULTS
IMPORTANT NOTICE! No representation is being made that the use of this strategy or any system or trading methodology will generate profits. Past performance is not necessarily indicative of future results. There is substantial risk of loss associated with trading securities and options on equities. Only risk capital should be used to trade. Trading securities is not suitable for everyone.
Disclaimer: Futures, Options, and Currency trading all have large potential rewards, but they also have large potential risk. You must be aware of the risks and be willing to accept them in order to invest in these markets. Don’t trade with money you can’t afford to lose.
This website is neither a solicitation nor an offer to Buy/Sell futures, options, or currencies. No representation is being made that any account will or is likely to achieve profits or losses similar to those discussed on this web site. The past performance of any trading system or methodology is not necessarily indicative of future results.
CFTC RULE 4.41 –HYPOTHETICAL OR SIMULATED PERFORMANCE RESULTS HAVE CERTAIN LIMITATIONS. UNLIKE AN ACTUAL PERFORMANCE RECORD, SIMULATED RESULTS DO NOT REPRESENT ACTUAL TRADING. ALSO, SINCE THE TRADES HAVE NOT BEEN EXECUTED, THE RESULTS MAY HAVE UNDER-OR-OVER COMPENSATED FOR THE IMPACT, IF ANY, OF CERTAIN MARKET FACTORS, SUCH AS LACK OF LIQUIDITY. SIMULATED TRADING PROGRAMS IN GENERAL ARE ALSO SUBJECT TO THE FACT THAT THEY ARE DESIGNED WITH THE BENEFIT OF HINDSIGHT. NO REPRESENTATION IS BEING MADE THAT ANY ACCOUNT WILL OR IS LIKELY TO ACHIEVE PROFIT OR LOSSES SIMILAR TO THOSE SHOWN