
S&P 500

Prior Session was Cycle Day 2: Textbook (CD2) as price tested both the upside and downside zone edges outlined in the prior DTS Briefing 8.27.24. As price volatility continues to contract during this “end-of-summer” balancing phase, the key Fulcrum Level has been 5630 handle.
Member Libby71 pointed out that by utilizing the Anchored VWAP (video) from the August 22nd low price has defined the current balancing range beautifully.(see today’s chart screenshot). Range was 38 handles on 965k contracts exchanged.
…Transition from Cycle Day 2 to Cycle Day 3
This leads us into Cycle Day 3: Price is currently above the Cycle Day 1 Low (5619.75), so expectation is for satisfaction of the 3 Day Cycle statistic, which has a 90% historical tracking that P > CD1 Low on CD3. There continues to be high potential for price to break higher fulfilling cycle range objective (5675).
Our discipline of maintaining positioning that is aligned with market forces continues to serve us well, so stay the course.
As such, scenarios to consider for today’s trading.
Bull Scenario: Price sustains a bid above 5650, initially targets 5665 – 5675 zone.
Bear Scenario: Price sustains an offer below 5630, initially targets 5615 – 5605 zone.
PVA High Edge = 5648 PVA Low Edge = 5632 Prior POC = 5643
ES Chart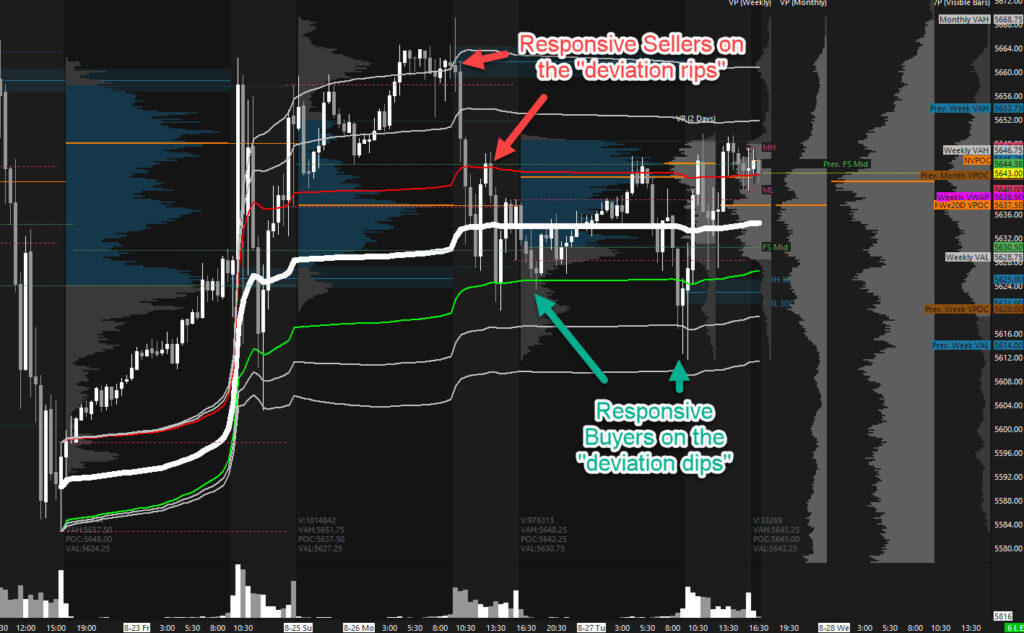
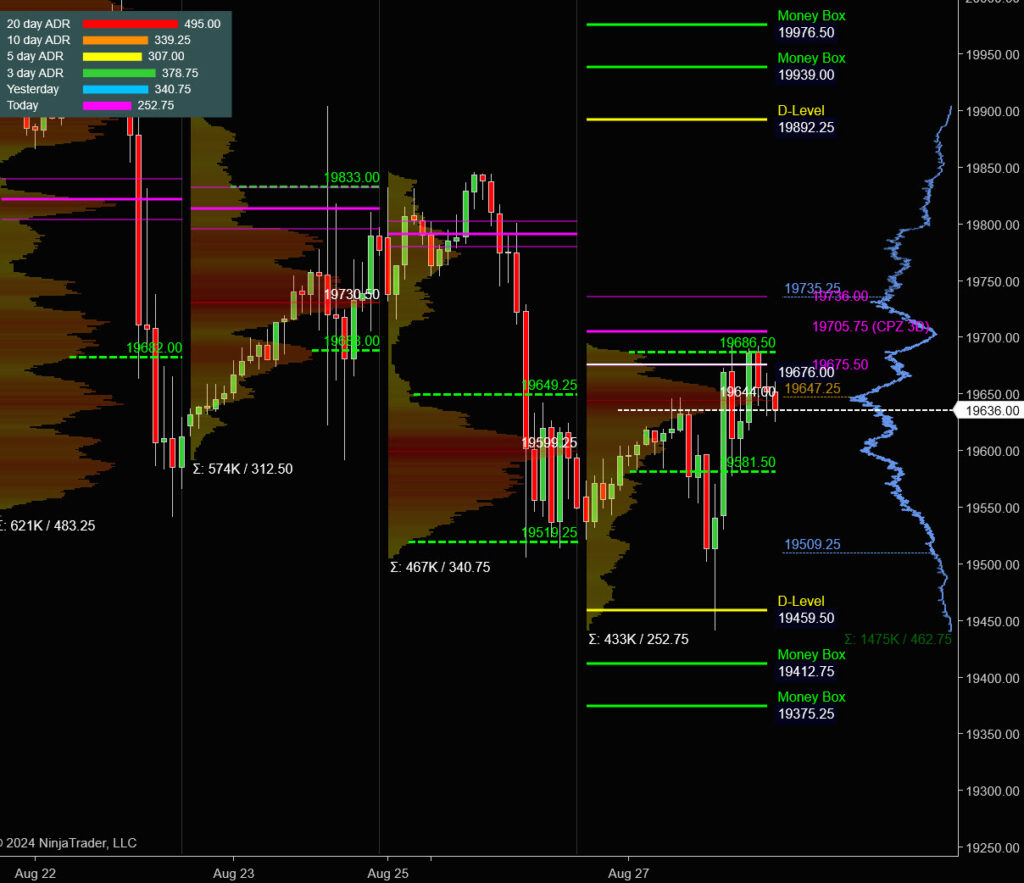
Nasdaq 100 (NQ)

Prior Session was Cycle Day 2: Textbook (CD2) as price tested both the upside and downside zone edges outlined in the prior DTS Briefing 8.27.24. As price volatility continues to contract during this “end-of-summer” balancing phase, the key Fulcrum Level is 19650 handle. Range was 252 handles on 433k contracts exchanged.
…Transition from Cycle Day 2 to Cycle Day 3
This leads us into Cycle Day 3: Price is currently above the Cycle Day 1 Low (19505.75), so expectation is for satisfaction of the 3 Day Cycle statistic, which has a 90% historical tracking that P > CD1 Low on CD3. There continues to be high potential for price to break higher fulfilling cycle range objective (19778).
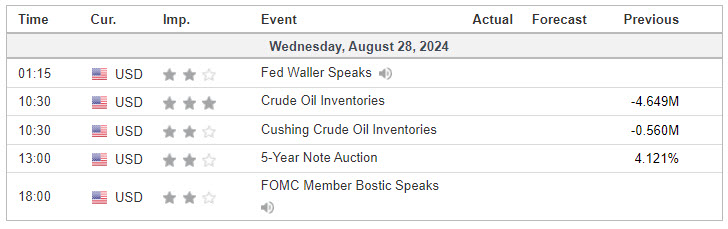
BIG Event for this session is NVDA earnings release after the closing bell. So pay close attention to todays market rhythm for directional expansionary lean.
Our discipline of maintaining positioning that is aligned with market forces continues to serve us well, so stay the course.
As such, scenarios to consider for today’s trading.
Bull Scenario: Price sustains a bid above 19650, initially targets 19745 – 19780 zone.
Bear Scenario: Price sustains an offer below 19650, initially targets 19550 – 19520 zone.
PVA High Edge = 19686 PVA Low Edge = 19582 Prior POC = 19644
NQ Chart
Economic Calendar
Trade Strategy: Our tactical trade strategy will simply remain unaltered…We’ll be flexible to trade both long and short side from Decision Pivot Levels. Continue to focus on Bull/Bear Stackers and Premium/Discounts. As always, remaining in alignment with dominant intra-day force increases probabilities of producing winning trades.
Stay Focused…Non-Biased…Disciplined ALWAYS USE STOPS!
Good Trading…David
“Knowing is not enough, We must APPLY. Willing is not enough, We must DO.” –BR
*****This trade strategy report is disseminated for “education only” and should not be viewed in any way as a recommendation to buy or sell futures products.”
PAST PERFORMANCE IS NOT NECESSARILY INDICATIVE OF FUTURE RESULTS
IMPORTANT NOTICE! No representation is being made that the use of this strategy or any system or trading methodology will generate profits. Past performance is not necessarily indicative of future results. There is substantial risk of loss associated with trading securities and options on equities. Only risk capital should be used to trade. Trading securities is not suitable for everyone.
Disclaimer: Futures, Options, and Currency trading all have large potential rewards, but they also have large potential risk. You must be aware of the risks and be willing to accept them in order to invest in these markets. Don’t trade with money you can’t afford to lose.
This website is neither a solicitation nor an offer to Buy/Sell futures, options, or currencies. No representation is being made that any account will or is likely to achieve profits or losses similar to those discussed on this web site. The past performance of any trading system or methodology is not necessarily indicative of future results.
CFTC RULE 4.41 –HYPOTHETICAL OR SIMULATED PERFORMANCE RESULTS HAVE CERTAIN LIMITATIONS. UNLIKE AN ACTUAL PERFORMANCE RECORD, SIMULATED RESULTS DO NOT REPRESENT ACTUAL TRADING. ALSO, SINCE THE TRADES HAVE NOT BEEN EXECUTED, THE RESULTS MAY HAVE UNDER-OR-OVER COMPENSATED FOR THE IMPACT, IF ANY, OF CERTAIN MARKET FACTORS, SUCH AS LACK OF LIQUIDITY. SIMULATED TRADING PROGRAMS IN GENERAL ARE ALSO SUBJECT TO THE FACT THAT THEY ARE DESIGNED WITH THE BENEFIT OF HINDSIGHT. NO REPRESENTATION IS BEING MADE THAT ANY ACCOUNT WILL OR IS LIKELY TO ACHIEVE PROFIT OR LOSSES SIMILAR TO THOSE SHOWN