
S&P 500

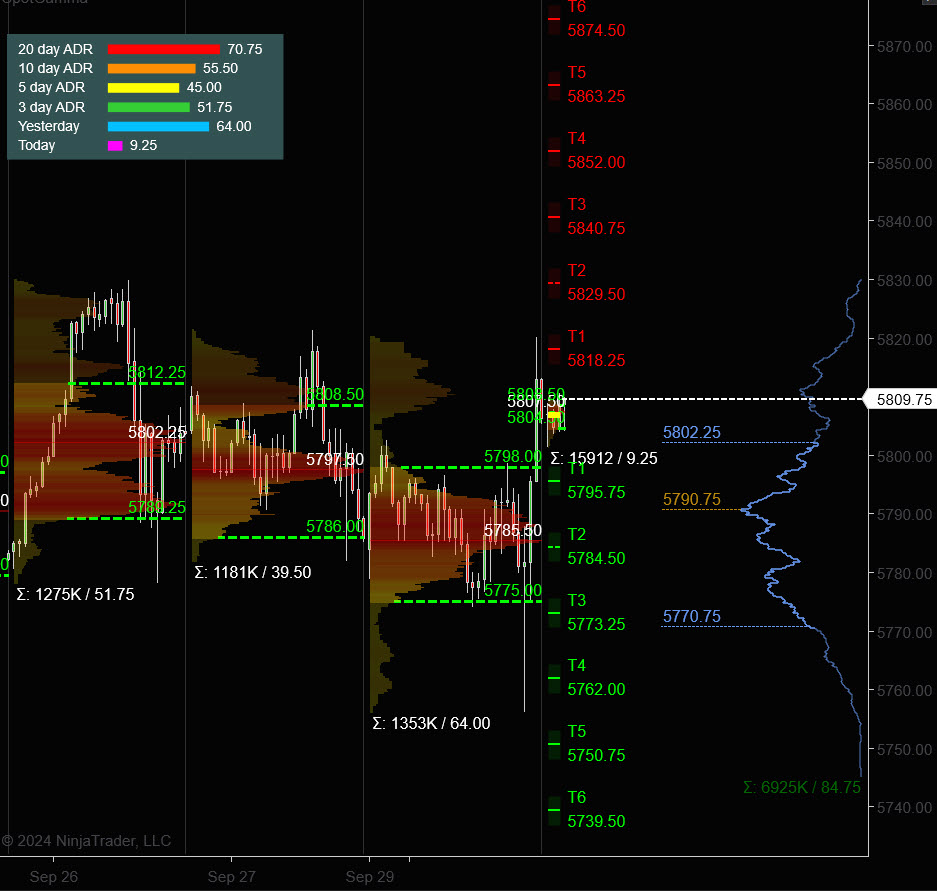
Prior Session was Cycle Day 2: Normal CD2 rhythms as price continued in “consolidation-mode” respecting key levels both on the lower end (5775 – 5755) and the upper end (5810 – 5815) of the multi-day composite range. Overall this day matched the expectations outlined in the Daily Trade Strategy Briefing. Range was 64 handles on 1.353M contracts exchanged.
For a more detailed recap of prior trading session click on this link: Trading Room RECAP 9.30.24
…Transition from Cycle Day 2 to Cycle Day 3
The transition to Cycle Day 3 suggests that bulls remain in control, with price holding above 5800, which supports a statistically favorable continuation of the uptrend. The key support zone is still anchored at 5785-5775, and as long as price stays above these levels, bulls have the advantage. However, if price falls below 5800 and sustains an offer, watch for a potential retest of 5780-5775, with further downside to 5755-5730 in the event of a breakdown.
Our discipline of maintaining positioning that is aligned with market forces continues to serve us well, so stay the course.
As such, scenarios to consider for today’s trading.
Bull Scenario: Price sustains a bid above 5800, initially targets 5820 – 5825 zone.
Bear Scenario: Price sustains an offer below 5800, initially targets 5780 – 5775 zone.
PVA High Edge = 5798 PVA Low Edge = 5775 Prior POC = 5785
ES Chart (Profile)
Nasdaq 100 (NQ)

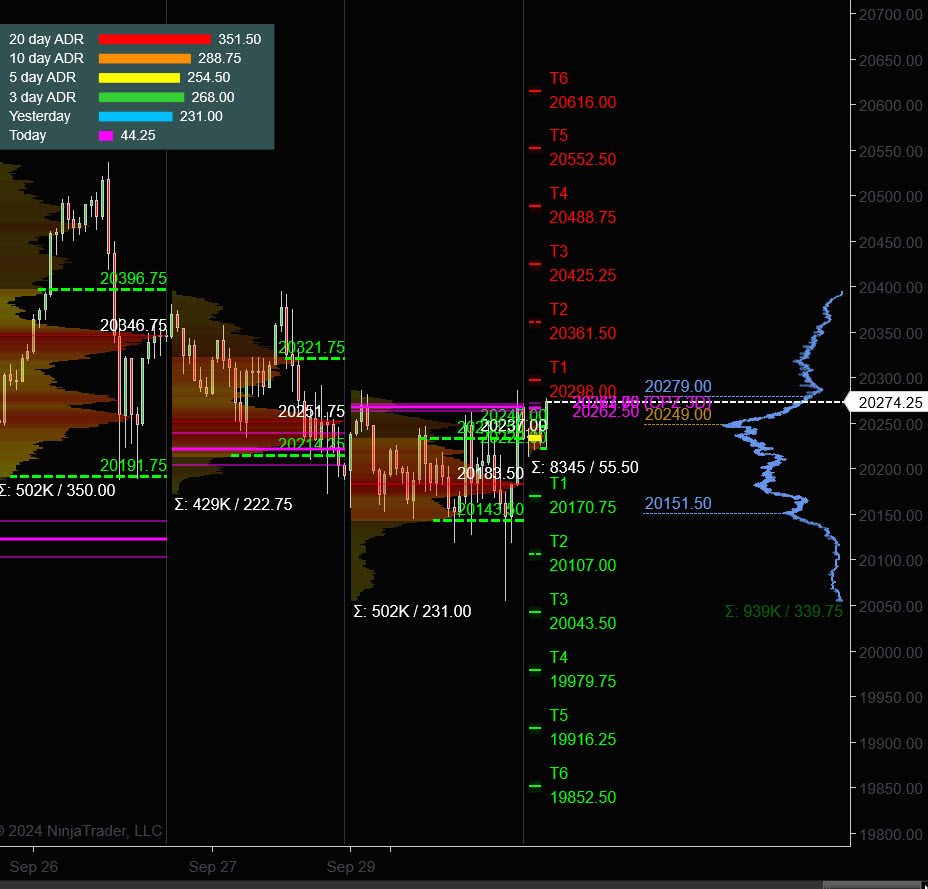
Prior Session was Cycle Day 2: Price oscillated around Mid-VWAP (20200) failing to gain any real traction on either side adhering to CD2 “normal” rhythms. Market on Close Buy Imbalance of $2.6 Billion aided in driving a “window-dressing” bid into the final bell. Range was 231 handles on 5002k contracts exchanged.
…Transition from Cycle Day 2 to Cycle Day 3
The transition to Cycle Day 3 suggests that bulls remain in control, with price holding above 20200, which supports a statistically favorable continuation of the uptrend. The key support zone is still anchored at 20160, and as long as price stays above these levels, bulls have the advantage. However, if price falls below 20120 and sustains an offer, watch for a potential retest of 20050 – 20000, with further downside to 19920 – 19900 in the event of a breakdown.
Our discipline of maintaining positioning that is aligned with market forces continues to serve us well, so stay the course.
As such, scenarios to consider for today’s trading.
Bull Scenario: Price sustains a bid above 20233, initially targets 20330– 20345 zone.
Bear Scenario: Price sustains an offer below 20233, initially targets 20185 – 20170 zone.
PVA High Edge = 20233 PVA Low Edge = 20143 Prior POC = 20184
NQ Chart (Profile)
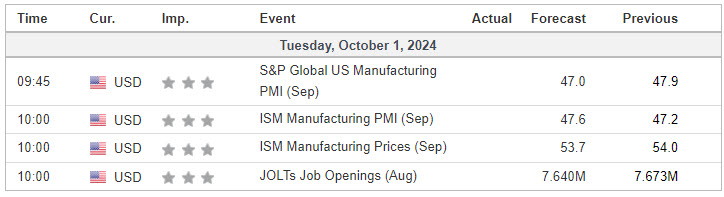
Economic Calendar
Trade Strategy: Our tactical trade strategy will simply remain unaltered…We’ll be flexible to trade both long and short side from Decision Pivot Levels. Continue to focus on Bull/Bear Stackers and Premium/Discounts. As always, remaining in alignment with dominant intra-day force increases probabilities of producing winning trades.
Stay Focused…Non-Biased…Disciplined ALWAYS USE STOPS!
Good Trading…David
“Knowing is not enough, We must APPLY. Willing is not enough, We must DO.” –BR
*****This trade strategy report is disseminated for “education only” and should not be viewed in any way as a recommendation to buy or sell futures products.”
PAST PERFORMANCE IS NOT NECESSARILY INDICATIVE OF FUTURE RESULTS
IMPORTANT NOTICE! No representation is being made that the use of this strategy or any system or trading methodology will generate profits. Past performance is not necessarily indicative of future results. There is substantial risk of loss associated with trading securities and options on equities. Only risk capital should be used to trade. Trading securities is not suitable for everyone.
Disclaimer: Futures, Options, and Currency trading all have large potential rewards, but they also have large potential risk. You must be aware of the risks and be willing to accept them in order to invest in these markets. Don’t trade with money you can’t afford to lose.
This website is neither a solicitation nor an offer to Buy/Sell futures, options, or currencies. No representation is being made that any account will or is likely to achieve profits or losses similar to those discussed on this web site. The past performance of any trading system or methodology is not necessarily indicative of future results.
CFTC RULE 4.41 –HYPOTHETICAL OR SIMULATED PERFORMANCE RESULTS HAVE CERTAIN LIMITATIONS. UNLIKE AN ACTUAL PERFORMANCE RECORD, SIMULATED RESULTS DO NOT REPRESENT ACTUAL TRADING. ALSO, SINCE THE TRADES HAVE NOT BEEN EXECUTED, THE RESULTS MAY HAVE UNDER-OR-OVER COMPENSATED FOR THE IMPACT, IF ANY, OF CERTAIN MARKET FACTORS, SUCH AS LACK OF LIQUIDITY. SIMULATED TRADING PROGRAMS IN GENERAL ARE ALSO SUBJECT TO THE FACT THAT THEY ARE DESIGNED WITH THE BENEFIT OF HINDSIGHT. NO REPRESENTATION IS BEING MADE THAT ANY ACCOUNT WILL OR IS LIKELY TO ACHIEVE PROFIT OR LOSSES SIMILAR TO THOSE SHOWN