
🚀 Cycle Day 3 — Jumping the Creek
Thursday arrived carrying a rather formidable statistical tailwind:
Positive Three-Day Cycle: ~93% Historical Performance
And once again, Mr. Market demonstrated why we trade probabilities rather than opinions.
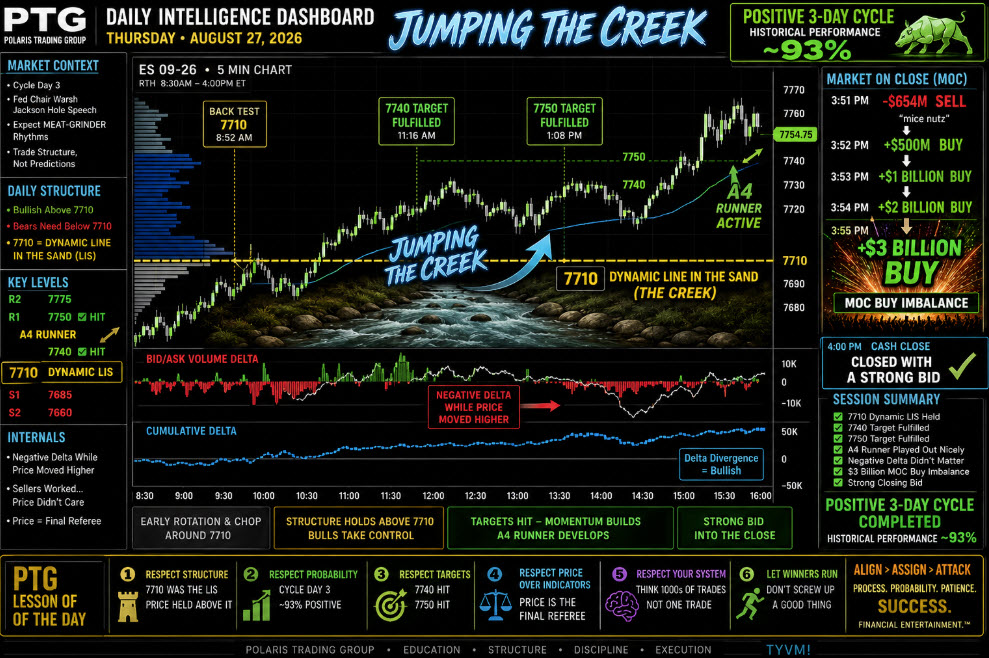
The session began with price back-testing 7710, which quickly earned promotion to the day’s Dynamic Line in the Sand.
Above 7710?
Bulls owned the football.
Below 7710?
The bears might finally get invited onto the field.
Simple enough.
Of course, markets rarely have any interest in making simple things look simple.
🎯 7710 — The Dynamic Line in the Sand
Early trade remained rotational and somewhat indecisive around the 7710 area, while David warned that the session had all the ingredients for some good old-fashioned:
🥩 MEAT-GRINDER RHYTHMS
With Fed Chair Warsh’s first Jackson Hole speech looming, there was every reason to expect traders to spend portions of the session enthusiastically accomplishing absolutely nothing.
Translation:
Chop first. Opportunity later.
The important distinction was that despite the intraday noise, price continued holding the bullish structural framework.
That mattered.
🧠 Probability Thinking Takes Center Stage
Much of the morning discussion focused not simply on where to trade, but on how professional traders should think.
The lesson was particularly relevant on Cycle Day 3.
The market doesn’t owe anyone the next trade.
The trader’s job isn’t to predict every wiggle.
The job is to identify a repeatable edge, execute that edge consistently, control risk and allow the statistics to work across a meaningful sample size.
Ram summed it up beautifully:
Trust the system you trade, remain consistent with it, and stop judging yourself trade-by-trade. Think in terms of thousands of trades.
Dan immediately nominated the sentence for permanent residence on everyone’s trading monitor.
Hard to argue with that.
Because one trade is noise.
Process repeated over hundreds and thousands of occurrences is where expectancy lives.
🟢 Bulls Start Jumping the Creek
As the morning developed, buyers began pressing the upper boundary of the developing structure.
What initially resembled a wedge eventually resolved higher.
And then came the first important receipt from the Daily Trade Strategy Briefing:
🎯 7740 TARGET — FULFILLED
At approximately 11:16 AM, 7740 traded, checking off the first major upside objective.
TYVM.
The market had effectively begun Jumping the Creek.
Rather than attempting to heroically predict the exact tick where the rally would fail, the higher-probability approach remained painfully boring:
Respect the trend until price proves otherwise.
Or, as Barbara reminded the room:
The trend is your friend.
Amazing how those ancient trading clichés keep surviving despite several billion dollars being spent every year attempting to replace them with algorithms.
🎯 7750 — TARGET ACQUIRED
The afternoon brought the next confirmation.
At approximately 1:08 PM:
🎯 7750 TARGET — FULFILLED
Another Daily Trade Strategy objective went into the books.
7710 → 7740 → 7750
The bullish auction continued doing precisely what a healthy bullish auction is supposed to do:
Seek higher prices until sufficient opposing inventory appears.
And apparently the bears had misplaced theirs.
🚀 A4 Runner Goes to Work
With 7750 fulfilled, the A4 runner continued developing nicely.
This was an important distinction.
Once the initial objectives were satisfied, traders didn’t need to manufacture another prediction.
The market itself was providing the information.
Structure remained constructive.
Price remained bid.
Momentum remained intact.
Therefore:
Let the runner run.
Sometimes sophisticated trading involves complex quantitative analysis.
Other times it involves possessing enough discipline to simply leave the damn thing alone.
⚠️ Negative Delta While Price Climbed
One particularly interesting feature developed during the afternoon advance.
Despite price continuing higher:
Delta remained NEGATIVE.
That prompted the inevitable question:
How can Bid/Ask Ratio remain red while price keeps moving higher?
Because Bid/Ask Volume Ratio measures the net difference in volume delta.
Negative delta does not automatically mean price must decline.
Aggressive selling can be absorbed by passive buyers.
And when sellers repeatedly hit bids yet price refuses to break lower, somebody on the other side may be quietly accepting all that inventory.
That creates one of the more fascinating auction-market tells:
Selling pressure without corresponding downside price progress.
Translation?
Sellers were working.
Price simply wasn’t particularly impressed.
Never confuse order-flow activity with actual price response.
Price remains the final referee.
🧀 The Closing MOC Comedy Show
Then came the closing auction.
At 3:51 PM, the Market-on-Close indication showed approximately:
🔴 $654 Million SELL
David’s technical institutional assessment:
“mice nutz.”
Fair enough.
Then things became considerably more interesting.
Within minutes:
$500 Million BUY
became…
$1 BILLION BUY
then…
$2 BILLION BUY
and finally…
💰 $3 BILLION BUY IMBALANCE
Well then.
That escalated quickly.
The market responded accordingly.
At the 4:00 PM bell:
🚀 ES CLOSED WITH A STRONG BID
The creek had officially been jumped.
The bulls crossed the bridge, stole the picnic basket and apparently left the bears wondering whether the Jackson Hole symposium offered continuing-education credits.
📊 Cycle Day 3 — STATISTIC SATISFIED
The most important structural achievement of the session came at the close:
🟢 POSITIVE THREE-DAY CYCLE SATISFIED
Historical Performance Rate: approximately 93%
Once again:
Probability — not prophecy.
The statistic never promised that every tick would travel higher.
It simply provided a historically favorable framework within which price could be evaluated.
And Thursday delivered.
7710 Dynamic LIS held.
7740 fulfilled.
7750 fulfilled.
A4 runner developed.
Negative delta failed to derail price.
$3 Billion MOC Buy Imbalance appeared into the close.
Strong closing bid.
And the Positive Three-Day Cycle completed its assignment.
TYVM.
🎓 PTG EDUCATIONAL TAKEAWAY
Thursday’s lesson extended well beyond simply identifying the correct market direction.
Alignment → Assignment → Attack
1. Respect Structure
7710 became the Dynamic Line in the Sand.
Price held above it.
That established the framework.
2. Respect Probability
Cycle Day 3 carried approximately a 93% Positive Three-Day Cycle historical performance rate.
Statistics provided the edge.
They did not provide certainty.
3. Respect Targets
7740 was fulfilled.
7750 was fulfilled.
No fortune teller required.
4. Respect Price Over Indicators
Negative delta persisted while price advanced.
Price won the argument.
5. Respect Your System
Stop allowing the outcome of one trade to determine whether your methodology “works.”
Think in samples.
Think expectancy.
Think thousands of occurrences.
6. Let Winners Perform
Once the A4 runner was working, the trader’s primary responsibility became considerably more difficult:
Don’t screw it up.
🦊 SILVER FOX FINAL WORD
Cycle Day 3 delivered another textbook lesson in why PTG trades price, structure and probabilities rather than predictions.
The morning offered noise.
The structure offered information.
The targets offered opportunity.
And the closing auction offered roughly $3 billion worth of punctuation.
The market doesn’t care about our opinions.
It doesn’t care about our indicators.
And it certainly doesn’t care where we think it should reverse.
Respect the statistics.
Respect the structure.
Respect price.
Everything else remains…
Financial Entertainment.™
Positive Three-Day Cycle: ~93%
Mission accomplished.
TYVM!