
Markets
Stocks across the globe are going green again as investors digest the Phase One trade deal, which is expected to nearly double U.S. exports to China over the next two years. Shanghai is ahead by 0.6% and the Euro Stoxx 50 up 0.8%, while S&P 500 and Nasdaq futures are 0.4% higher and the Dow is expected to tack on 60 points at the open. Over in Britain, the FTSE 100 is advancing 2% for a second session on reduced uncertainty as Prime Minister Boris Johnson eyes a parliament vote before Christmas to “get Brexit done.”
In Asia, Japan -0.3%. Hong Kong -0.7%. China +0.6%. India -0.2%.
In Europe, at midday, London +2%. Paris +0.8%. Frankfurt +0.5%.
Futures at 6:20, Dow +0.2%. S&P +0.4%. Nasdaq +0.4%. Crude -0.1% to $60.03. Gold flat at $1481.70. Bitcoin -0.7% to $7051.
Ten-year Treasury Yield +2 bps to 1.84%
Source: Seeking Alpha https://seekingalpha.com/
Economic Calendar
8:30 Empire State Mfg Survey
9:45 PMI Composite Flash
10:00 NAHB Housing Market Index
https://www.investing.com/economic-calendar/
***New: PTG Trading Room Chat Log’s Link
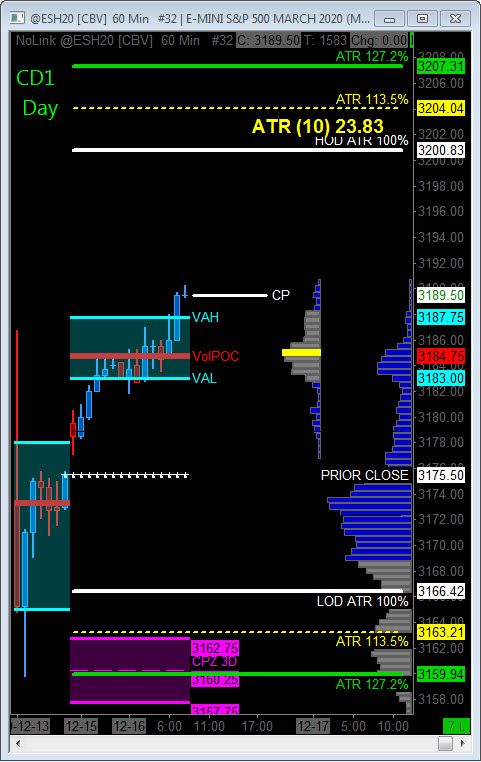
S&P 500
Today is Cycle Day 1 (CD1)…Normal is for a decline measuring 3162. Average Range for CD1 is 30.00 handles. Odds of decline > 10 handles = 73% Odds of decline > 20 = 44%
CD1 Range High = 3207.00 CD1 Range Low = 3166.00 CD1 Range Avg = 30.00
Scenario 1: IF Bulls hold bid above 3185, THEN initial upside targets 3197 – 3203 CD1 Penetration Zone.
Scenario 2: IF Bears hold offer below 3185, THEN initial downside targets 3175 – 3168 zone.
Range Projections and Key Levels (ES) March 2020 (H) Contract
HOD ATR Range Projection: 3200.00; LOD ATR Range Projection: 3166.00; 3 Day Central Pivot: 3160.00; 3 Day Cycle Target: 3213.00; 10 Day Average True Range 23.83; VIX: 12.00
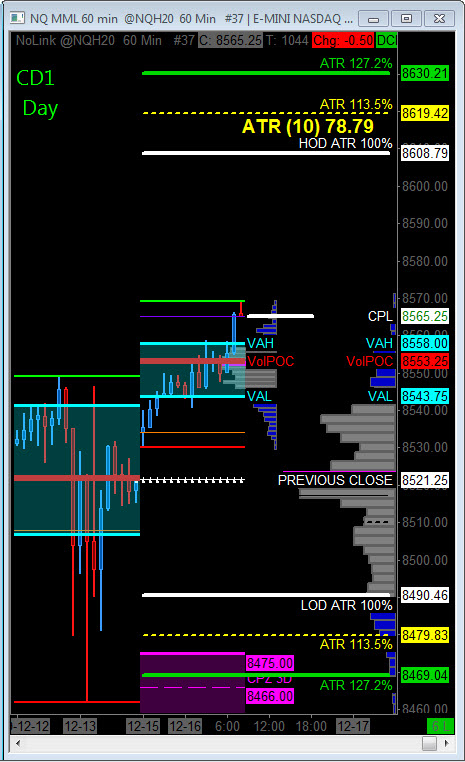
Nasdaq 100 (NQ)
Today is Cycle Day 1 (CD1)…Normal is for a decline measuring 8465.00. Average Range for CD1 is 103.00 handles. Odds of decline > 20 handles = 75% Odds of decline > 25 = 67%
CD1 Range High =8588.00 CD1 Range Low = 8510.00 CD1 Range Avg = 103.00
Scenario 1: IF Bulls hold bid above 8553, THEN initial upside targets 8571 – 8588 CD1 Penetration Zone.
Scenario 2: IF Bears hold offer below 8553, THEN initial downside targets 8540 – 8530 zone.
Range Projections and Key Levels (NQ) March 2020 (H) Contract
HOD ATR Range Projection: 8607.00; LOD ATR Range Projection: 8490.00; 3 Day Central Pivot: 8466.00; 3 Day Cycle Target: 8602.00; 10 Day Average True Range: 78.79; VIX: 12.00
Trade Strategy: Our tactical trade strategy will simply remain unaltered…We’ll be flexible to trade both long and short side from Decision Pivot Levels. Continue to focus on Bull/Bear Stackers and Premium/Discounts. As always, remaining in alignment with dominant intra-day force increases probabilities of producing winning trades.
Stay Focused…Non-Biased…Disciplined ALWAYS USE STOPS!
Good Trading…David
“Knowing is not enough, We must APPLY. Willing is not enough, We must DO.” –Bruce Lee
*****This trade strategy report is disseminated for “education only” and should not be viewed in any way as a recommendation to buy or sell futures products.”
PAST PERFORMANCE IS NOT NECESSARILY INDICATIVE OF FUTURE RESULTS
IMPORTANT NOTICE! No representation is being made that the use of this strategy or any system or trading methodology will generate profits. Past performance is not necessarily indicative of future results. There is substantial risk of loss associated with trading securities and options on equities. Only risk capital should be used to trade. Trading securities is not suitable for everyone.
Disclaimer: Futures, Options, and Currency trading all have large potential rewards, but they also have large potential risk. You must be aware of the risks and be willing to accept them in order to invest in these markets. Don’t trade with money you can’t afford to lose.
This website is neither a solicitation nor an offer to Buy/Sell futures, options, or currencies. No representation is being made that any account will or is likely to achieve profits or losses similar to those discussed on this web site. The past performance of any trading system or methodology is not necessarily indicative of future results.
CFTC RULE 4.41 –HYPOTHETICAL OR SIMULATED PERFORMANCE RESULTS HAVE CERTAIN LIMITATIONS. UNLIKE AN ACTUAL PERFORMANCE RECORD, SIMULATED RESULTS DO NOT REPRESENT ACTUAL TRADING. ALSO, SINCE THE TRADES HAVE NOT BEEN EXECUTED, THE RESULTS MAY HAVE UNDER-OR-OVER COMPENSATED FOR THE IMPACT, IF ANY, OF CERTAIN MARKET FACTORS, SUCH AS LACK OF LIQUIDITY. SIMULATED TRADING PROGRAMS IN GENERAL ARE ALSO SUBJECT TO THE FACT THAT THEY ARE DESIGNED WITH THE BENEFIT OF HINDSIGHT. NO REPRESENTATION IS BEING MADE THAT ANY ACCOUNT WILL OR IS LIKELY TO ACHIEVE PROFIT OR LOSSES SIMILAR TO THOSE SHOWN