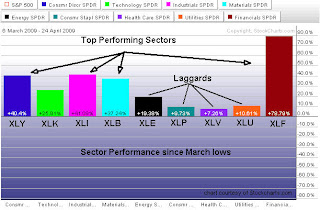
 The above chart displays the Nine Sectors that comprise the S&P 500 Index and their relative performance versus the SP500 benchmark. The Bears have maintained that the current rally from the March lows is nothing more than a typical “bear market rally”, while the Bulls have been quietly optimistic given the damage that has been done. A closer examination of the sectors provides the objective trader a realistic view (not subjective) of the underlying strength and weakness in the SP500.
“Not All Sectors are Made Equal”. Typically at market bottoms the sectors that should lead on a relative basis are Financials, Consumer Discretionary, Technology, Industrials and Basic Materials. As you can see from the chart above those are exactly the areas that have exhibited the strongest relative strength during the current rally. The more defensive sectors such as Healthcare, Utilities, Energy, and Consumer Staples should be laggards. Again, this is the case.
So, the jury is out whether this rally is nothing more that a “bear market rally” or the beginning of a new Bull Market. It is important to the trader to keep close watch on these nine sectors when price action does pullback and the current rally ends, as that will be a tell-tale sign regarding the bull/bear outcome.
