
Markets

As the Federal Reserve ratchets up interest rates, inflation has started to cool, according to many recent economic reports. Most recently, wage growth rose less than expected in the December non-farm payrolls report, resulting in further assurance that a wage-price spiral has not developed. Average hourly earnings from previous months also included significant downward revisions, giving hope that price pressures will finally melt away
Snapshot: Investors today will see if that trend is continuing when the Department of Labor publishes the latest Consumer Price Index. Headline inflation is expected to rise 6.5% Y/Y in December, easing from 7.1% in November, and dropping for the sixth consecutive month. Core CPI – which excludes volatile food and energy prices – is expected to increase 5.7% vs. 6.0% in November, but it comes as a new term emerges for market watchers to focus on – “supercore inflation.”
Fed Chair Jerome Powell mentioned at his December press conference that the services component of inflation, excluding housing, was particularly concerning as that tends to be harder to root out than goods inflation. Some are even going more hardcore, sizing up the figure without housing and healthcare, or even other categories. Also keep in mind that Fed policymakers generally give more weight to core personal consumption expenditures, rather than the CPI, which has diverged more than usual since early last year.
Source: SeekingAlpha.com
Economic Calendar
8:30 Consumer Price Index
8:30 Initial Jobless Claims
10:30 EIA Natural Gas Inventory
11:30 Fed’s Bullard Speech
12:40 PM Fed’s Barkin Speech
2:00 PM Treasury Statement
4:30 PM Fed Balance Sheet
https://www.investing.com/economic-calendar/
S&P 500

Prior Session was Cycle Day 2 (CD2): Futures prices continued to rally as optimism on the CPI print this morning continued to spread widely across market participants. FOMO was a driver should the print be better than expected, as no portfolio manager/trader wants to be “left-behind” on a positive print, yet willing to get slammed on a disappointing report. Call it the “trader mentality.” Prior range was 58 handles on 1.333M contracts exchanged.
…Transition from Cycle Day 2 to Cycle Day 3
This leads us into Cycle Day 3 (CD3): Three-Day Cycle Rally is in-place as the all-important CPI print is due for release @ 8:30 ET. We’ll mark today as a “wild-card” with the pending report. As such, estimated scenarios to consider for today’s trading.
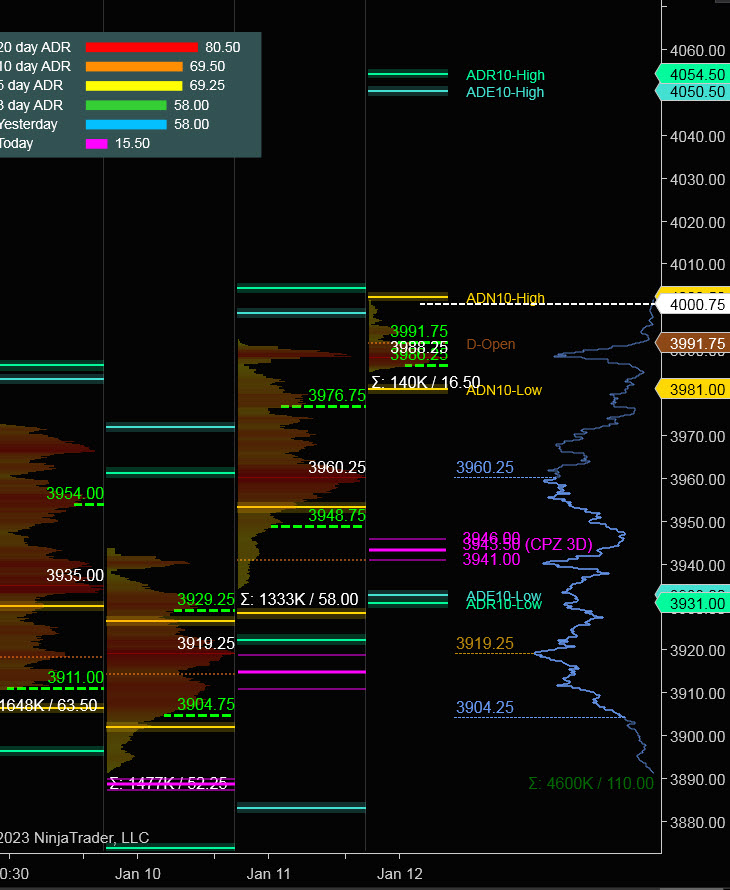
Bull Scenario: Price sustains a bid above 3990, initially targets 4025 – 4030 zone.
Bear Scenario: Price sustains an offer below 3990, initially targets 3955 – 3950 zone.
PVA High Edge = 3976 PVA Low Edge = 3948 Prior POC = 3960
Range Projections and Key Levels (ES) March 2023 (H) Contract
HOD ATR Range Projection: 4054; LOD ATR Range Projection: 3930; 3 Day Central Pivot: 3944; 3 Day Cycle Target: 3996; 10 Day Average True Range 69; VIX: 21
Nasdaq 100 (NQ)

Today is Cycle Day 3 (CD3)…Three-Day Cycle Rally is in-place as the all-important CPI print is due for release @ 8:30 ET. We’ll mark today as a “wild-card” with the pending report. As such, estimated scenarios to consider for today’s trading.
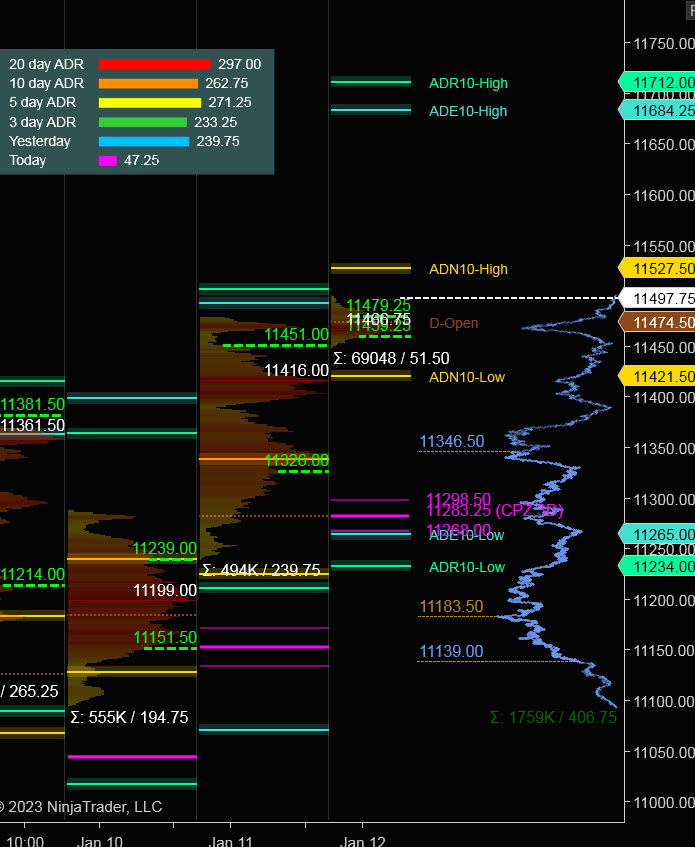
Bull Scenario: IF Bulls sustains bid above 11475, THEN initial upside estimate targets 11610– 11620 zone.
Bear Scenario: IF Bears sustains offer below 11475, THEN initial downside estimate targets 11345 – 11335 zone.
PVA High Edge = 11451 PVA Low Edge = 11326 Prior POC = 11416
Range Projections and Key Levels (NQ) March 2022 (H) Contract
HOD ATR Range Projection: 11712; LOD ATR Range Projection: 11233; 3 Day Central Pivot: 11283; 3 Day Cycle Target: 11540; 10 Day Average True Range: 262; VIX: 21
Trade Strategy: Our tactical trade strategy will simply remain unaltered…We’ll be flexible to trade both long and short side from Decision Pivot Levels. Continue to focus on Bull/Bear Stackers and Premium/Discounts. As always, remaining in alignment with dominant intra-day force increases probabilities of producing winning trades.
Stay Focused…Non-Biased…Disciplined ALWAYS USE STOPS!
Good Trading…David
“Knowing is not enough, We must APPLY. Willing is not enough, We must DO.” –Bruce Lee
*****This trade strategy report is disseminated for “education only” and should not be viewed in any way as a recommendation to buy or sell futures products.”
PAST PERFORMANCE IS NOT NECESSARILY INDICATIVE OF FUTURE RESULTS
IMPORTANT NOTICE! No representation is being made that the use of this strategy or any system or trading methodology will generate profits. Past performance is not necessarily indicative of future results. There is substantial risk of loss associated with trading securities and options on equities. Only risk capital should be used to trade. Trading securities is not suitable for everyone.
Disclaimer: Futures, Options, and Currency trading all have large potential rewards, but they also have large potential risk. You must be aware of the risks and be willing to accept them in order to invest in these markets. Don’t trade with money you can’t afford to lose.
This website is neither a solicitation nor an offer to Buy/Sell futures, options, or currencies. No representation is being made that any account will or is likely to achieve profits or losses similar to those discussed on this web site. The past performance of any trading system or methodology is not necessarily indicative of future results.
CFTC RULE 4.41 –HYPOTHETICAL OR SIMULATED PERFORMANCE RESULTS HAVE CERTAIN LIMITATIONS. UNLIKE AN ACTUAL PERFORMANCE RECORD, SIMULATED RESULTS DO NOT REPRESENT ACTUAL TRADING. ALSO, SINCE THE TRADES HAVE NOT BEEN EXECUTED, THE RESULTS MAY HAVE UNDER-OR-OVER COMPENSATED FOR THE IMPACT, IF ANY, OF CERTAIN MARKET FACTORS, SUCH AS LACK OF LIQUIDITY. SIMULATED TRADING PROGRAMS IN GENERAL ARE ALSO SUBJECT TO THE FACT THAT THEY ARE DESIGNED WITH THE BENEFIT OF HINDSIGHT. NO REPRESENTATION IS BEING MADE THAT ANY ACCOUNT WILL OR IS LIKELY TO ACHIEVE PROFIT OR LOSSES SIMILAR TO THOSE SHOWN