
Markets
After briefly topping the 29,000 milestone on Friday, the Dow looks set to firmly regain the level today as futures start the week with a 125-point advance. The blue-chip market benchmark has now racked up 10,676 points since election day 2016 as the historic bull market tears higher in the new year. More movement will likely be seen during the week. Earnings season kicks off with major Wall Street banks, while investors will get details of the “Phase One” trade agreement with China.
In Asia, Japan closed. Hong Kong +0.8%. China +1.1%. India +0.6%.
In Europe, at midday, London +0.6%. Paris +0.3%. Frankfurt +0.2%.
Futures at 6:20, Dow +0.4%. S&P +0.4%. Nasdaq +0.5%. Crude +0.3% to $59.20. Gold -0.7% to $1549.10. Bitcoin -0.4% to $8084.
Ten-year Treasury Yield +2 bps to 1.84%
Source: Seeking Alpha https://seekingalpha.com/
Economic Calendar
10:00 Fed’s Rosengren Speech
12:40 PM Fed’s Bostic: Monetary Policy and Economic Outlook
2:00 PM Treasury Budget
https://www.investing.com/economic-calendar/
***New: PTG Trading Room Chat Log’s Link
S&P 500
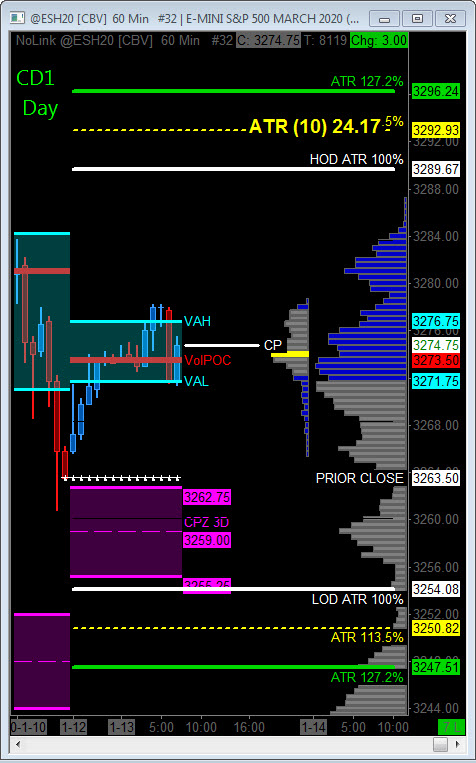
Today is Cycle Day 1 (CD1)…Normal is for a decline measuring 3263.00. Average Range for CD1 is 29.00 handles. Odds of decline > 10 handles = 73% Odds of decline > 20 = 44%
CD1 Range High = 3289.00 CD1 Range Low = 3249.00 CD1 Range Avg = 29.00
Bull Scenario: IF Bulls hold bid above 3274, THEN initial upside targets 3280 – 3285 zone.
Bear Scenario: IF Bears hold offer below 3274, THEN initial downside targets 3268 – 3263 zone.
Range Projections and Key Levels (ES) March 2020 (H) Contract
HOD ATR Range Projection: 3290.00; LOD ATR Range Projection: 3254.00; 3 Day Central Pivot: 3259.00; 3 Day Cycle Target: 3302.50; 10 Day Average True Range 24.17; VIX: 12.78
Nasdaq 100 (NQ)
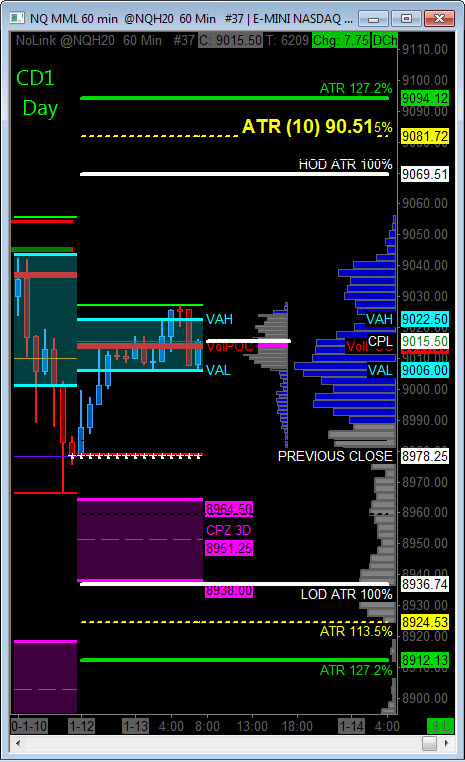
Today is Cycle Day 1 (CD1)…Normal is for a decline measuring 8974.50. Average Range for CD1 is 106.00 handles. Odds of decline > 20 handles = 75% Odds of decline > 25 = 67%
CD1 Range High = 9038.00 CD1 Range Low = 8968.00 CD1 Range Avg = 106.00
Bull Scenario: IF Bulls hold bid above 9014, THEN initial upside targets 9027 – 9037 zone.
Bear Scenario: IF Bears hold offer below 9014, THEN initial downside targets 9000 – 8978 zone.
Range Projections and Key Levels (NQ) March 2020 (H) Contract
HOD ATR Range Projection: 9070.00; LOD ATR Range Projection: 8937.00; 3 Day Central Pivot: 8951.00; 3 Day Cycle Target: 9115.00; 10 Day Average True Range: 90.50; VIX: 12.78
Trade Strategy: Our tactical trade strategy will simply remain unaltered…We’ll be flexible to trade both long and short side from Decision Pivot Levels. Continue to focus on Bull/Bear Stackers and Premium/Discounts. As always, remaining in alignment with dominant intra-day force increases probabilities of producing winning trades.
Stay Focused…Non-Biased…Disciplined ALWAYS USE STOPS!
Good Trading…David
“Knowing is not enough, We must APPLY. Willing is not enough, We must DO.” –Bruce Lee
*****This trade strategy report is disseminated for “education only” and should not be viewed in any way as a recommendation to buy or sell futures products.”
PAST PERFORMANCE IS NOT NECESSARILY INDICATIVE OF FUTURE RESULTS
IMPORTANT NOTICE! No representation is being made that the use of this strategy or any system or trading methodology will generate profits. Past performance is not necessarily indicative of future results. There is substantial risk of loss associated with trading securities and options on equities. Only risk capital should be used to trade. Trading securities is not suitable for everyone.
Disclaimer: Futures, Options, and Currency trading all have large potential rewards, but they also have large potential risk. You must be aware of the risks and be willing to accept them in order to invest in these markets. Don’t trade with money you can’t afford to lose.
This website is neither a solicitation nor an offer to Buy/Sell futures, options, or currencies. No representation is being made that any account will or is likely to achieve profits or losses similar to those discussed on this web site. The past performance of any trading system or methodology is not necessarily indicative of future results.
CFTC RULE 4.41 –HYPOTHETICAL OR SIMULATED PERFORMANCE RESULTS HAVE CERTAIN LIMITATIONS. UNLIKE AN ACTUAL PERFORMANCE RECORD, SIMULATED RESULTS DO NOT REPRESENT ACTUAL TRADING. ALSO, SINCE THE TRADES HAVE NOT BEEN EXECUTED, THE RESULTS MAY HAVE UNDER-OR-OVER COMPENSATED FOR THE IMPACT, IF ANY, OF CERTAIN MARKET FACTORS, SUCH AS LACK OF LIQUIDITY. SIMULATED TRADING PROGRAMS IN GENERAL ARE ALSO SUBJECT TO THE FACT THAT THEY ARE DESIGNED WITH THE BENEFIT OF HINDSIGHT. NO REPRESENTATION IS BEING MADE THAT ANY ACCOUNT WILL OR IS LIKELY TO ACHIEVE PROFIT OR LOSSES SIMILAR TO THOSE SHOWN