
Markets
The rocky start to 2022 is continuing into earnings season as a jump in Treasury yields continues to unnerve investors. The 10-year Treasury yield climbed 6 basis points overnight to 1.83%, a level last seen two years ago, before the first U.S. COVID-19 case was recorded in Jan. 2020. Fears of tighter monetary policy (and the Fed’s fight against inflation) have already dragged the S&P 500 and Nasdaq down 2.2% and 4.8%, respectively, in the first two weeks of the year, and futures linked to the indexes fell another 1.3% and 1.9% overnight.
Source: SeekingAlpha.com
Economic Calendar
8:30 Empire State Mfg Survey
10:00 NAHB Housing Market Index
https://www.investing.com/economic-calendar/
***New: PTG Trading Room Chat Log’s Link
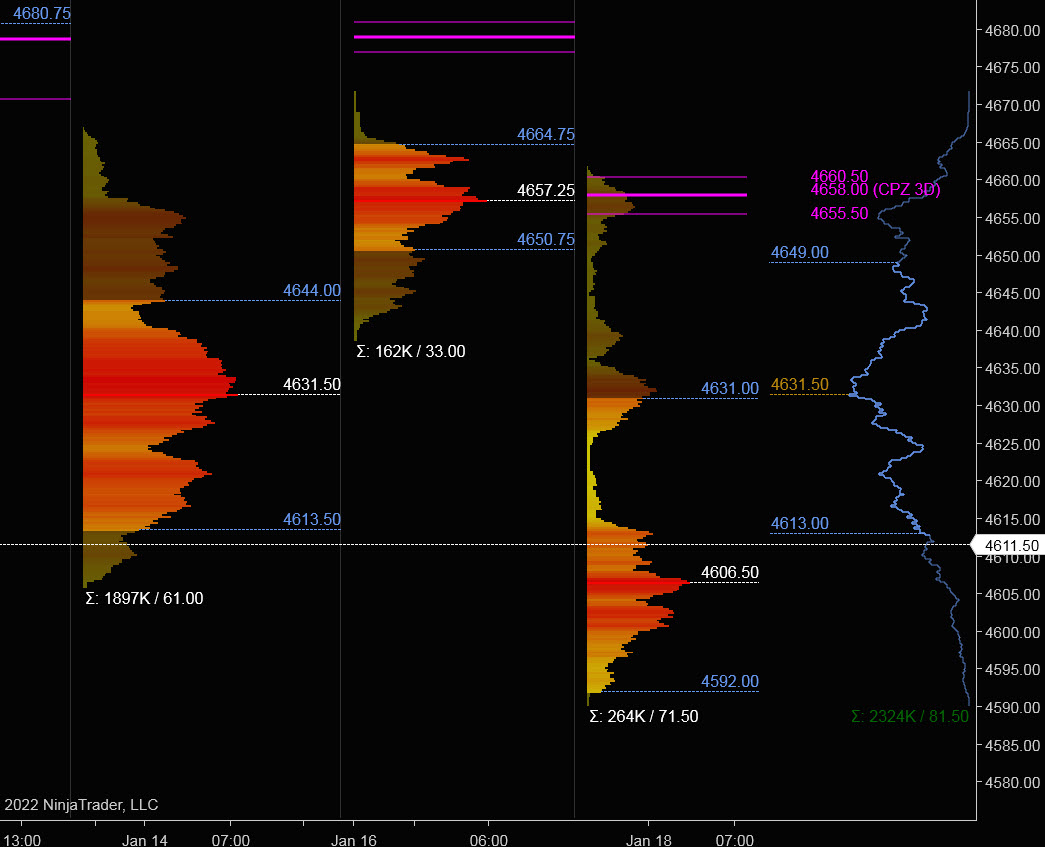
S&P 500

Prior Session was Cycle Day 3 (CD3): Quiet holiday shortened session….Prior range was 33 handles on 162k contracts exchanged.
…Transition from Cycle Day 3 to Cycle Day 1
This leads us into Cycle Day 1 (CD1): Today begins a new cycle, with the Average Decline measuring 4598 which has been fulfilled during overnight trade activity. Price is currently trading back near 5-day VAL (4613) pre-RTH. As such, estimated scenarios to consider for today’s trading.
1.) Price sustains a bid above 4613, initially targets 4623 – 4632 zone.
2.) Price sustains an offer below 4613, initially targets 4603 – 4593 zone.
*****3 Day Cycle has a 91% probability of fulfilling Positive Cycle Statistics covering 12 years of recorded tracking history.
PVA High Edge = 4664 PVA Low Edge = 4650 Prior POC = 4658
Range Projections and Key Levels (ES) March 2022 (H) Contract
HOD ATR Range Projection: 4658; LOD ATR Range Projection: 4594; 3 Day Central Pivot: 4658; 3 Day Cycle Target: 4658; 10 Day Average True Range; 68; VIX: 21
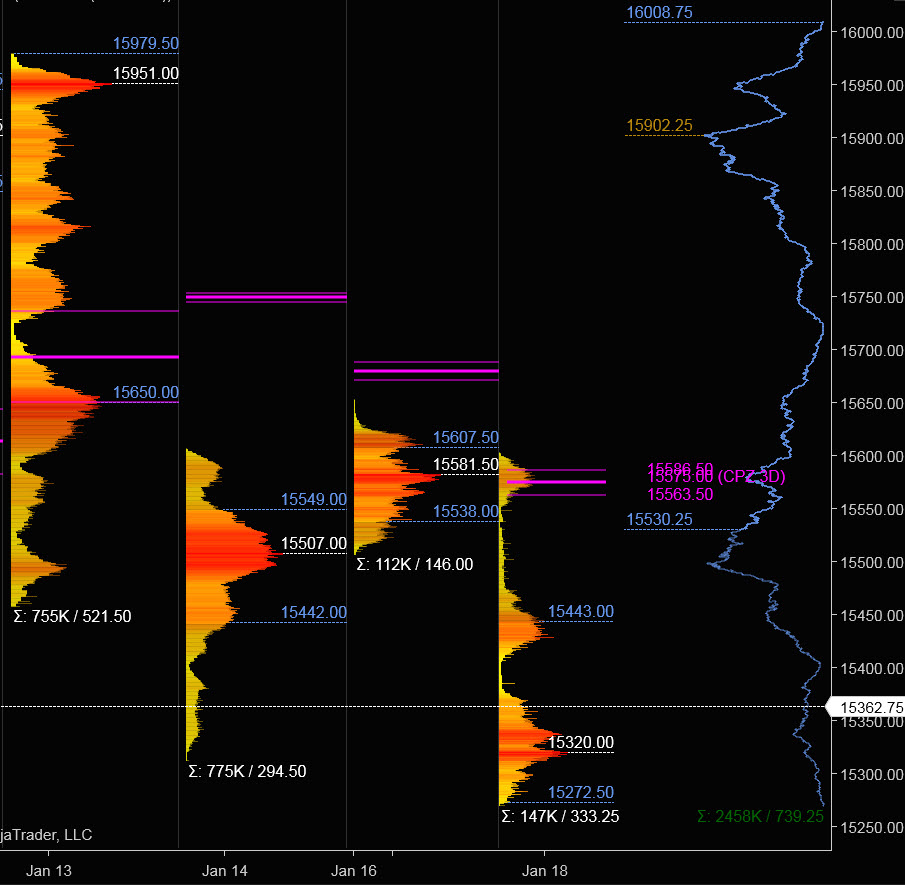
Nasdaq 100 (NQ)

Today is Cycle Day 1 (CD1)…Average Decline projection is 15263 for this cycle day. Price is trading within Friday’s range after selling down during GLOBEX. Prior range was 294 handles on 775k contracts exchanged. As such, there are two estimated scenarios to consider for today’s trading.
PVA High Edge = 15607 PVA Low Edge = 15442 Prior POC = 15320
Bull Scenario: IF Bulls sustain a bid above 15380, THEN initial upside estimate targets 15442 – 15474 zone.
Bear Scenario: IF Bears sustain an offer below 15380, THEN initial downside estimate targets 15320– 15272 zone.
Range Projections and Key Levels (NQ) March 2022 (H) Contract
HOD ATR Range Projection: 15646; LOD ATR Range Projection: 15227; 3 Day Central Pivot: 15575; 3 Day Cycle Target: 15380; 10 Day Average True Range: 376; VIX: 21
Trade Strategy: Our tactical trade strategy will simply remain unaltered…We’ll be flexible to trade both long and short side from Decision Pivot Levels. Continue to focus on Bull/Bear Stackers and Premium/Discounts. As always, remaining in alignment with dominant intra-day force increases probabilities of producing winning trades.
Stay Focused…Non-Biased…Disciplined ALWAYS USE STOPS!
Good Trading…David
“Knowing is not enough, We must APPLY. Willing is not enough, We must DO.” –Bruce Lee
*****This trade strategy report is disseminated for “education only” and should not be viewed in any way as a recommendation to buy or sell futures products.”
PAST PERFORMANCE IS NOT NECESSARILY INDICATIVE OF FUTURE RESULTS
IMPORTANT NOTICE! No representation is being made that the use of this strategy or any system or trading methodology will generate profits. Past performance is not necessarily indicative of future results. There is substantial risk of loss associated with trading securities and options on equities. Only risk capital should be used to trade. Trading securities is not suitable for everyone.
Disclaimer: Futures, Options, and Currency trading all have large potential rewards, but they also have large potential risk. You must be aware of the risks and be willing to accept them in order to invest in these markets. Don’t trade with money you can’t afford to lose.
This website is neither a solicitation nor an offer to Buy/Sell futures, options, or currencies. No representation is being made that any account will or is likely to achieve profits or losses similar to those discussed on this web site. The past performance of any trading system or methodology is not necessarily indicative of future results.
CFTC RULE 4.41 –HYPOTHETICAL OR SIMULATED PERFORMANCE RESULTS HAVE CERTAIN LIMITATIONS. UNLIKE AN ACTUAL PERFORMANCE RECORD, SIMULATED RESULTS DO NOT REPRESENT ACTUAL TRADING. ALSO, SINCE THE TRADES HAVE NOT BEEN EXECUTED, THE RESULTS MAY HAVE UNDER-OR-OVER COMPENSATED FOR THE IMPACT, IF ANY, OF CERTAIN MARKET FACTORS, SUCH AS LACK OF LIQUIDITY. SIMULATED TRADING PROGRAMS IN GENERAL ARE ALSO SUBJECT TO THE FACT THAT THEY ARE DESIGNED WITH THE BENEFIT OF HINDSIGHT. NO REPRESENTATION IS BEING MADE THAT ANY ACCOUNT WILL OR IS LIKELY TO ACHIEVE PROFIT OR LOSSES SIMILAR TO THOSE SHOWN