
Markets
World stock markets are getting back to full strength as investors cheered measures to contain the outbreak of a potentially deadly coronavirus. DJIA futures are pointing to a 100-point gain at the open, while tech rallies on earnings from Netflix (NFLX) and IBM (IBM).
In Asia, Japan +0.7%. Hong Kong +1.3%. China +0.3%. India -0.5%.
In Europe, at midday, London +0.1%. Paris flat. Frankfurt flat.
Futures at 6:20, Dow +0.3%. S&P +0.4%. Nasdaq +0.7%. Crude -0.7% to $57.96. Gold flat at $1557.90. Bitcoin -0.2% to $8640.
Ten-year Treasury Yield flat at 1.77%
Source: Seeking Alpha https://seekingalpha.com
Economic Calendar
8:30 Chicago Fed National Activity Index
8:55 Redbook Chain Store Sales
9:00 FHFA House Price Index
10:00 Existing Home Sales
https://www.investing.com/economic-calendar/
***PTG Trading Room Chat Log’s Link
S&P 500 (ES)
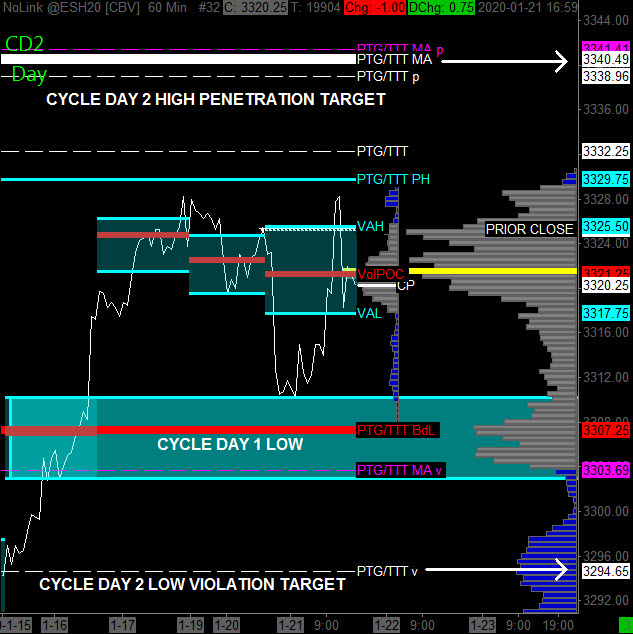
Prior Session was a Cycle Day 1 (CD1) Normal was for a decline which unfolded and reached lower projected level during GLOBEX with 100% short inventory. Expected response was for a counter-auction to relieve the bearish condition. Open Range was bullish out of the gate as this Cycle’s Rally began to unfold, auctioning price higher filling Friday’s gap. Buyers “dried-up” near highs as sellers pushed price lower during afternoon session settling at 5-day Point of Control.
Today is a Cycle Day 2 (CD2) Normal is for “back n fill” price action as Value is forming a 3-day consolidation range. Key Line -in-Sand (LIS) is marked at 3317 for bulls to defend. Should sellers take control, retest of CD1 Low (3307.25) would be anticipated. Bears will need to defend 3-day Value High 3326. Overall bullish trend remains intact.
IF Prior High (3329.75) is cleared, THEN CD2 Upper Penetration Target Zone measures 3339 – 3341. IF 3317 (LIS) is violated and converted to lower resistance, THEN deeper downside targets CD1 Low (3307.25), followed by 3303 CD2 Violation Level.
*****ANNOUNCEMENT: PTG Trader Tool Box Indicator & Strategy Suite is now available for NinjaTrader 8 trading platform.
*****The 3 Day Cycle Spreadsheet which subscribers receive shortly after market close for next trading session contains all the projected range targets. Here is link to web page to learn more: https://polaristradinggroup.com/ptg-3-day-cycle/
CD2 Range High = 3341.00 CD2 Range Low = 3312.00 CD2 Range Avg = 24.50
Bull Scenario: IF Bulls hold bid above 3330, THEN initial upside potential targets 3337 – 3341 zone.
Bear Scenario: IF Bears hold offer below 3330, THEN initial downside objective targets 3322 – 3318 zone.
Range Projections and Key Levels (ES) March 2020 (H) Contract
HOD ATR Range Projection: 3337.00; LOD ATR Range Projection: 3318.00; 3 Day Central Pivot: 3322.00; 3 Day Cycle Target: 3336.00; 10 Day Average True Range 17.75: VIX: 12.37
Nasdaq 100 (NQ)
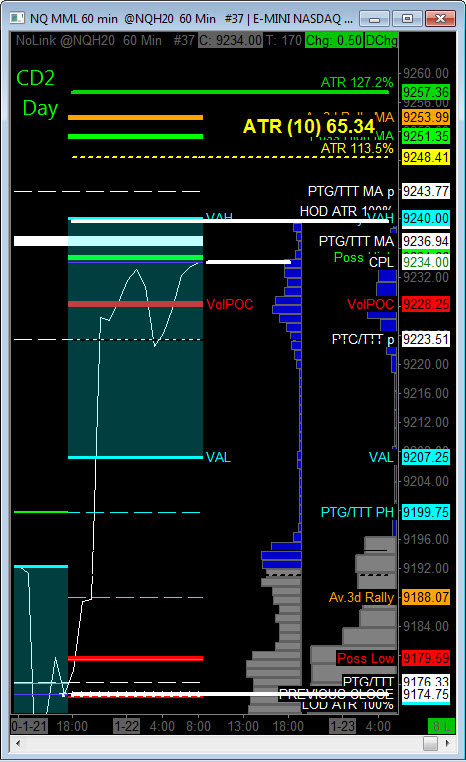
Today is Cycle Day 2 (CD2)…Price has fulfilled 3 Day Cycle Target 9188.00 and continue to extend gains during GLOBEX Session.
CD2 Range High = 9235.00 CD2 Range Low = 9180.00 CD2 Range Avg = 60.41
Bull Scenario: IF Bulls hold bid above 9200, THEN initial upside potential targets 9224 – 9240 zone.
Bear Scenario: IF Bears hold offer below 9200, THEN initial downside objective targets 9180 – 9170 zone.
Range Projections and Key Levels (NQ) March 2020 (H) Contract
HOD ATR Range Projection: 9240.00; LOD ATR Range Projection: 9175.00 3 Day Central Pivot: 9165.00; 3 Day Cycle Target: 9188.00; 10 Day Average True Range: 65.35; VIX: 12.37
Trade Strategy: Our tactical trade strategy will simply remain unaltered…We’ll be flexible to trade both long and short side from Decision Pivot Levels. Continue to focus on Bull/Bear Stackers and Premium/Discounts. As always, remaining in alignment with dominant intra-day force increases probabilities of producing winning trades.
Stay Focused…Non-Biased…Disciplined ALWAYS USE STOPS!
Good Trading…David
“Knowing is not enough, We must APPLY. Willing is not enough, We must DO.” –Bruce Lee
*****This trade strategy report is disseminated for “education only” and should not be viewed in any way as a recommendation to buy or sell futures products.”
PAST PERFORMANCE IS NOT NECESSARILY INDICATIVE OF FUTURE RESULTS
IMPORTANT NOTICE! No representation is being made that the use of this strategy or any system or trading methodology will generate profits. Past performance is not necessarily indicative of future results. There is substantial risk of loss associated with trading securities and options on equities. Only risk capital should be used to trade. Trading securities is not suitable for everyone.
Disclaimer: Futures, Options, and Currency trading all have large potential rewards, but they also have large potential risk. You must be aware of the risks and be willing to accept them in order to invest in these markets. Don’t trade with money you can’t afford to lose.
This website is neither a solicitation nor an offer to Buy/Sell futures, options, or currencies. No representation is being made that any account will or is likely to achieve profits or losses similar to those discussed on this web site. The past performance of any trading system or methodology is not necessarily indicative of future results.
CFTC RULE 4.41 –HYPOTHETICAL OR SIMULATED PERFORMANCE RESULTS HAVE CERTAIN LIMITATIONS. UNLIKE AN ACTUAL PERFORMANCE RECORD, SIMULATED RESULTS DO NOT REPRESENT ACTUAL TRADING. ALSO, SINCE THE TRADES HAVE NOT BEEN EXECUTED, THE RESULTS MAY HAVE UNDER-OR-OVER COMPENSATED FOR THE IMPACT, IF ANY, OF CERTAIN MARKET FACTORS, SUCH AS LACK OF LIQUIDITY. SIMULATED TRADING PROGRAMS IN GENERAL ARE ALSO SUBJECT TO THE FACT THAT THEY ARE DESIGNED WITH THE BENEFIT OF HINDSIGHT. NO REPRESENTATION IS BEING MADE THAT ANY ACCOUNT WILL OR IS LIKELY TO ACHIEVE PROFIT OR LOSSES SIMILAR TO THOSE SHOWN