
Markets (Top Stories)

Source: seekingalpha.com
Economic Calendar

https://www.investing.com/economic-calendar/
S&P 500

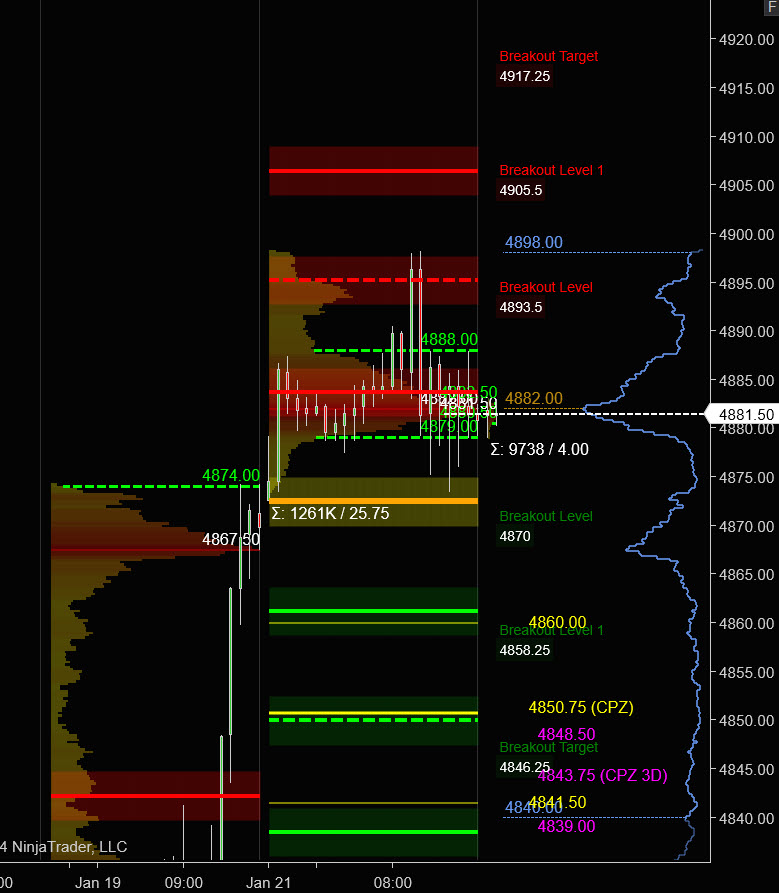
Prior Session was Cycle Day 3 (CD3): Price extended this cycle’s rally to Penetration Level (4887.50) where sellers responded, reversing lower, finding support at 4880 level outlined in trading room. (see link to chat logs below) Prior range was 25 handles on 1.261M contracts exchanged.
Note: You can view daily Trading Room Chat Logs at: https://www.dropbox.com/home/PTG%20MTS%20Trading%20Room%20Chat%20Logs
…Transition from Cycle Day 3 to Cycle Day 1
This leads us into Cycle Day 1 (CD1): Average Decline measures 4860. Today, we will mark 4880 as new Line-In-Sand (LIS) Bulls were able to establish higher value during yesterday’s consolidation, so control is theirs to lose. As such, scenarios to consider for today’s trading.
Bull Scenario: Price sustains a bid above 4880, initially targets 4895 – 4905 zone.
Bear Scenario: Price sustains an offer below 4880, initially targets 4865 – 4860 zone.
PVA High Edge = 4888 PVA Low Edge = 4879 Prior POC = 4882
Range Projections and Key Levels (ES) March 2024 (H) Contract
HOD ATR Range Projection: 4931; LOD ATR Range Projection: 4830; 3 Day Central Pivot: 4843; 3 Day Cycle Target: 4917; 10 Day Average True Range 52; VIX: 13
Nasdaq 100 (NQ)

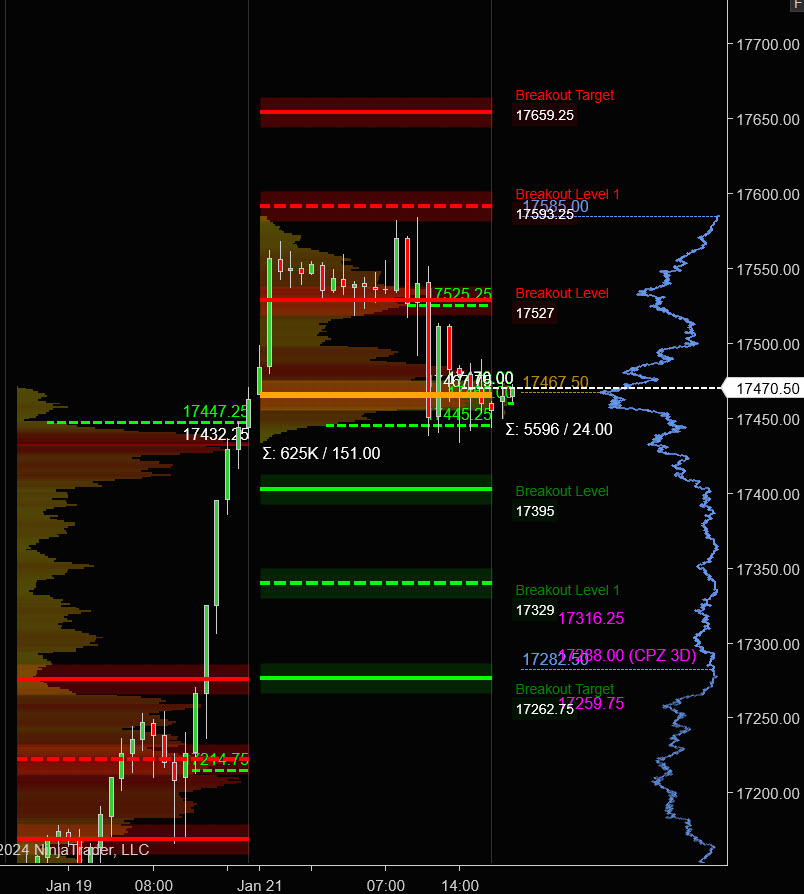
Prior Session was Cycle Day 3 (CD3): Range parameters (17445 – 17545) outlined in prior DTS 01/22/24 briefing contained majority of price consolidation. Prior range was 151 handles on 625k contracts exchanged.
Note: You can view daily ATR Levels at: https://polaristradinggroup.com/daily-range-calculator/
…Transition from Cycle Day 3 to Cycle Day 1
This leads us into Cycle Day 1 (CD1): Average Decline measures 17415. We will once again mark 17445 as Line-In-Sand (LIS) for today’s session as buyers responded, shifting value higher. Violation and conversion of this level opens trap door to fulfill decline projection. As such, scenarios to consider for today’s trading.
Bull Scenario: Price sustains a bid above 17445, initially targets 17505 – 17515 zone.
Bear Scenario: Price sustains an offer below 17445, initially targets 17415 – 17395 zone.
PVA High Edge = 17525 PVA Low Edge = 17445 Prior POC = 17467
Range Projections and Key Levels (NQ) March 2024 (H) Contract
HOD ATR Range Projection: 17713; LOD ATR Range Projection: 17211; 3 Day Central Pivot: 17298; 3 Day Cycle Target: 17659; 10 Day Average True Range: 262; VIX: 13
Trade Strategy: Our tactical trade strategy will simply remain unaltered…We’ll be flexible to trade both long and short side from Decision Pivot Levels. Continue to focus on Bull/Bear Stackers and Premium/Discounts. As always, remaining in alignment with dominant intra-day force increases probabilities of producing winning trades.
Stay Focused…Non-Biased…Disciplined ALWAYS USE STOPS!
Good Trading…David
“Knowing is not enough, We must APPLY. Willing is not enough, We must DO.” –Bruce Lee
*****This trade strategy report is disseminated for “education only” and should not be viewed in any way as a recommendation to buy or sell futures products.”
PAST PERFORMANCE IS NOT NECESSARILY INDICATIVE OF FUTURE RESULTS
IMPORTANT NOTICE! No representation is being made that the use of this strategy or any system or trading methodology will generate profits. Past performance is not necessarily indicative of future results. There is substantial risk of loss associated with trading securities and options on equities. Only risk capital should be used to trade. Trading securities is not suitable for everyone.
Disclaimer: Futures, Options, and Currency trading all have large potential rewards, but they also have large potential risk. You must be aware of the risks and be willing to accept them in order to invest in these markets. Don’t trade with money you can’t afford to lose.
This website is neither a solicitation nor an offer to Buy/Sell futures, options, or currencies. No representation is being made that any account will or is likely to achieve profits or losses similar to those discussed on this web site. The past performance of any trading system or methodology is not necessarily indicative of future results.
CFTC RULE 4.41 –HYPOTHETICAL OR SIMULATED PERFORMANCE RESULTS HAVE CERTAIN LIMITATIONS. UNLIKE AN ACTUAL PERFORMANCE RECORD, SIMULATED RESULTS DO NOT REPRESENT ACTUAL TRADING. ALSO, SINCE THE TRADES HAVE NOT BEEN EXECUTED, THE RESULTS MAY HAVE UNDER-OR-OVER COMPENSATED FOR THE IMPACT, IF ANY, OF CERTAIN MARKET FACTORS, SUCH AS LACK OF LIQUIDITY. SIMULATED TRADING PROGRAMS IN GENERAL ARE ALSO SUBJECT TO THE FACT THAT THEY ARE DESIGNED WITH THE BENEFIT OF HINDSIGHT. NO REPRESENTATION IS BEING MADE THAT ANY ACCOUNT WILL OR IS LIKELY TO ACHIEVE PROFIT OR LOSSES SIMILAR TO THOSE SHOWN