
Markets

Economic Calendar
8:30 Durable Goods
8:30 GDP Q4
8:30 International Trade in Goods (Advance)
8:30 Initial Jobless Claims
8:30 Chicago Fed National Activity Index
8:30 Retail Inventories (Advance)
10:00 Wholesale Inventories (Advance)
10:00 New Home Sales
10:30 EIA Natural Gas Inventory
11:00 Kansas City Fed Mfg Survey
1:00 PM Results of $35B, 7-Year Note Auction
4:30 PM Fed Balance Sheet
https://www.investing.com/economic-calendar/
***New: PTG Trading Room Chat Log’s Link
S&P 500

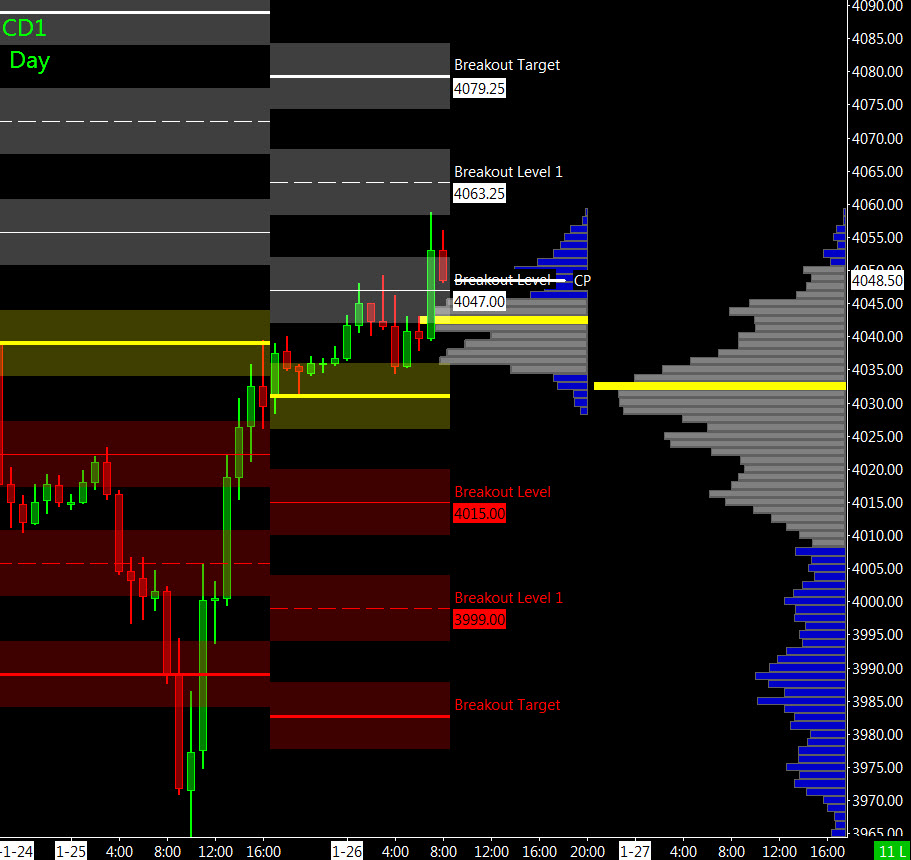
Prior Session was Cycle Day 3 (CD3): Price rallied in a “key reversal” day creating a V-bottom from 3965 handle, fulfilling 3-Day Cycle Statistic. Prior range was 77 handles on 1.702M contracts exchanged.
…Transition from Cycle Day 3 to Cycle Day 1
This leads us into Cycle Day 1 (CD1): Average Decline measures 3978. Normal for CD1 is a decline to find a new secure cycle low. Current momentum favors the bulls as price is pushing recent highs for a potential breakout. As such, estimated scenarios to consider for today’s trading.
Bull Scenario: Price sustains a bid above 4050, initially targets 4075 – 4080 zone.
Bear Scenario: Price sustains an offer below 4050, initially targets 4025 – 4020 zone.
PVA High Edge = 4035 PVA Low Edge = 3986 Prior POC = 4030
Range Projections and Key Levels (ES) March 2023 (H) Contract
HOD ATR Range Projection: 4092; LOD ATR Range Projection: 3988; 3 Day Central Pivot: 4022; 3 Day Cycle Target: 4105; 10 Day Average True Range 64; VIX: 19
Nasdaq 100 (NQ)

Today is Cycle Day 1 (CD1)…Average Decline measures 11734. Normal for CD1 is a decline to find a new secure cycle low. Current momentum favors the bulls as price is pushing recent highs for a potential breakout. As such, estimated scenarios to consider for today’s trading. As such, estimated scenarios to consider for today’s trading.
Bull Scenario: IF Bulls sustains bid above 11977, THEN initial upside estimate targets 12081– 12091 zone.
Bear Scenario: IF Bears sustains offer below 11977, THEN initial downside estimate targets 11880 – 11875 zone.
PVA High Edge = 11897 PVA Low Edge = 11700 Prior POC = 11870
Range Projections and Key Levels (NQ) March 2023 (H) Contract
HOD ATR Range Projection: 12127; LOD ATR Range Projection: 11742; 3 Day Central Pivot: 11871; 3 Day Cycle Target: 12254; 10 Day Average True Range: 260; VIX: 19

Trade Strategy: Our tactical trade strategy will simply remain unaltered…We’ll be flexible to trade both long and short side from Decision Pivot Levels. Continue to focus on Bull/Bear Stackers and Premium/Discounts. As always, remaining in alignment with dominant intra-day force increases probabilities of producing winning trades.
Stay Focused…Non-Biased…Disciplined ALWAYS USE STOPS!
Good Trading…David
“Knowing is not enough, We must APPLY. Willing is not enough, We must DO.” –Bruce Lee
*****This trade strategy report is disseminated for “education only” and should not be viewed in any way as a recommendation to buy or sell futures products.”
PAST PERFORMANCE IS NOT NECESSARILY INDICATIVE OF FUTURE RESULTS
IMPORTANT NOTICE! No representation is being made that the use of this strategy or any system or trading methodology will generate profits. Past performance is not necessarily indicative of future results. There is substantial risk of loss associated with trading securities and options on equities. Only risk capital should be used to trade. Trading securities is not suitable for everyone.
Disclaimer: Futures, Options, and Currency trading all have large potential rewards, but they also have large potential risk. You must be aware of the risks and be willing to accept them in order to invest in these markets. Don’t trade with money you can’t afford to lose.
This website is neither a solicitation nor an offer to Buy/Sell futures, options, or currencies. No representation is being made that any account will or is likely to achieve profits or losses similar to those discussed on this web site. The past performance of any trading system or methodology is not necessarily indicative of future results.
CFTC RULE 4.41 –HYPOTHETICAL OR SIMULATED PERFORMANCE RESULTS HAVE CERTAIN LIMITATIONS. UNLIKE AN ACTUAL PERFORMANCE RECORD, SIMULATED RESULTS DO NOT REPRESENT ACTUAL TRADING. ALSO, SINCE THE TRADES HAVE NOT BEEN EXECUTED, THE RESULTS MAY HAVE UNDER-OR-OVER COMPENSATED FOR THE IMPACT, IF ANY, OF CERTAIN MARKET FACTORS, SUCH AS LACK OF LIQUIDITY. SIMULATED TRADING PROGRAMS IN GENERAL ARE ALSO SUBJECT TO THE FACT THAT THEY ARE DESIGNED WITH THE BENEFIT OF HINDSIGHT. NO REPRESENTATION IS BEING MADE THAT ANY ACCOUNT WILL OR IS LIKELY TO ACHIEVE PROFIT OR LOSSES SIMILAR TO THOSE SHOWN