
Markets
Coronavirus anxiety and another 2.6% plunge from the Hang Seng Index overshadowed upbeat earnings from Tesla (NASDAQ:TSLA) and Microsoft (NASDAQ:MSFT) as U.S. stock index futures point to declines of 0.7% at the open. Meanwhile, the 10-year Treasury yield fell to its lowest level since early October, while crude futures declined 1.7% to $52.41/bbl
In Asia, Japan -1.7%. Hong Kong -2.6%. China closed. India -0.7%.
In Europe, at midday, London -0.6%. Paris -1.2%. Frankfurt -0.8%.
Futures at 6:20, Dow +0.7%. S&P +0.7%. Nasdaq +0.7%. Crude -1.7% to $52.41. Gold +0.9% to $1584.60. Bitcoin -0.4% to $9314.
Ten-year Treasury Yield -3 bps to 1.55%
Source: Seeking Alpha https://seekingalpha.com
Economic Calendar
8:30 Initial Jobless Claims
8:30 GDP Q4
10:30 EIA Natural Gas Inventory
4:30 PM Money Supply
4:30 PM Fed Balance Sheet
https://www.investing.com/economic-calendar/
***PTG Trading Room Chat Log’s Link
S&P 500 (ES)
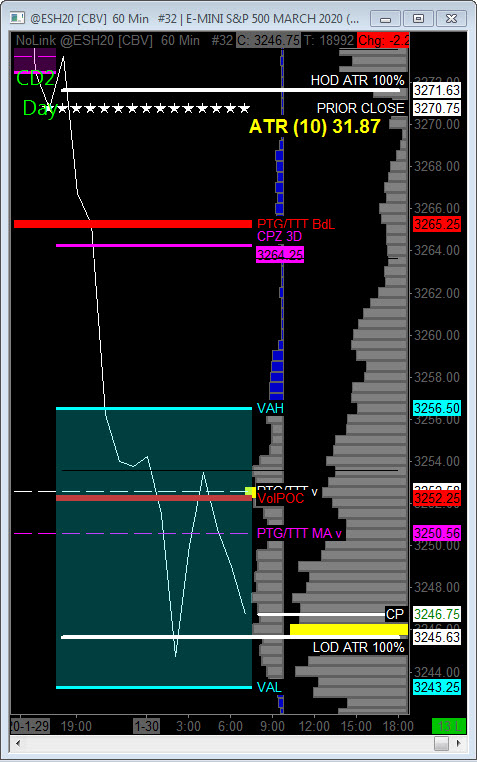
Today is a Cycle Day 2 (CD2)…Price is set up for a large gap down on the cash open. Currently trading near Jan-27th’s Point of Control (3245) is also a “match” to Cycle Day 2 Statistical Extreme Zone (3242 – 3245).
Initial resistance is marked at 3254 – 56 zone with support 3242 – 3245 zone.
Trade Strategy: Our tactical trade strategy will simply remain unaltered…We’ll be flexible to trade both long and short side from Decision Pivot Levels. Continue to focus on Bull/Bear Stackers and Premium/Discounts. As always, remaining in alignment with dominant intra-day force increases probabilities of producing winning trades.
*****ANNOUNCEMENT: PTG Trader Tool Box Indicator & Strategy Suite is now available for NinjaTrader 8 trading platform.
*****The 3 Day Cycle Spreadsheet which subscribers receive shortly after market close for next trading session contains all the projected range targets. Here is link to web page to learn more: https://polaristradinggroup.com/ptg-3-day-cycle/
CD2 Range High = 3262.00 CD2 Range Low = 3245.00 CD2 Range Avg = 25.50
Bull Scenario: IF Bulls hold bid above 3250, THEN initial upside potential targets 3260 – 3265 zone.
Bear Scenario: IF Bears hold offer below 3250, THEN initial downside objective targets 3240 – 3235 zone.
Range Projections and Key Levels (ES) March 2020 (H) Contract
HOD ATR Range Projection: 3270.00; LOD ATR Range Projection: 3245.00; 3 Day Central Pivot: 3265.00; 3 Day Cycle Target: 3294.00; 10 Day Average True Range 32.00: VIX: 18.00
Nasdaq 100 (NQ)
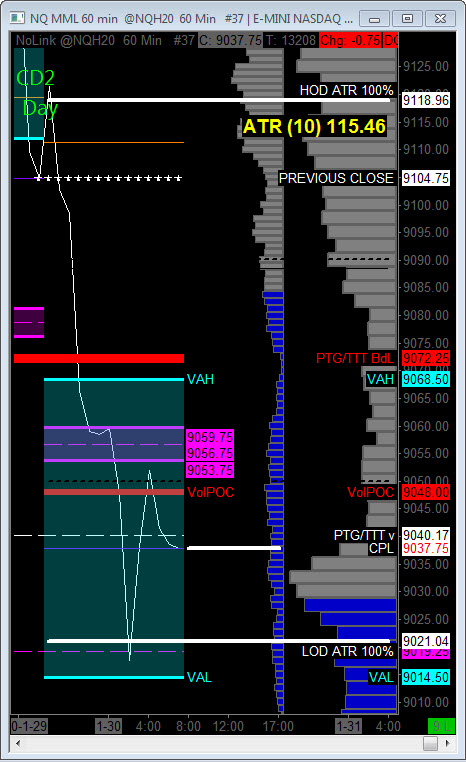
Today is Cycle Day 2 (CD2)…Price is set up for a large gap down on the cash open. Currently trading at CD2 Violation Range Low (9021) is marked as “key support” with resistance marked 9060 handle.
CD2 Range High = 9064.00 CD2 Range Low = 9021.00 CD2 Range Avg = 80.00
Bull Scenario: IF Bulls hold bid above 9048, THEN initial upside potential targets 9058 – 9072 zone.
Bear Scenario: IF Bears hold offer below 9048, THEN initial downside objective targets 9028 – 9014 zone.
Range Projections and Key Levels (NQ) March 2020 (H) Contract
HOD ATR Range Projection: 9118.00; LOD ATR Range Projection: 9021.00; 3 Day Central Pivot: 9057.00; 3 Day Cycle Target: 9146.00; 10 Day Average True Range: 115.00; VIX: 18.00
Trade Strategy: Our tactical trade strategy will simply remain unaltered…We’ll be flexible to trade both long and short side from Decision Pivot Levels. Continue to focus on Bull/Bear Stackers and Premium/Discounts. As always, remaining in alignment with dominant intra-day force increases probabilities of producing winning trades.
Stay Focused…Non-Biased…Disciplined ALWAYS USE STOPS!
Good Trading…David
“Knowing is not enough, We must APPLY. Willing is not enough, We must DO.” –Bruce Lee
*****This trade strategy report is disseminated for “education only” and should not be viewed in any way as a recommendation to buy or sell futures products.”
PAST PERFORMANCE IS NOT NECESSARILY INDICATIVE OF FUTURE RESULTS
IMPORTANT NOTICE! No representation is being made that the use of this strategy or any system or trading methodology will generate profits. Past performance is not necessarily indicative of future results. There is substantial risk of loss associated with trading securities and options on equities. Only risk capital should be used to trade. Trading securities is not suitable for everyone.
Disclaimer: Futures, Options, and Currency trading all have large potential rewards, but they also have large potential risk. You must be aware of the risks and be willing to accept them in order to invest in these markets. Don’t trade with money you can’t afford to lose.
This website is neither a solicitation nor an offer to Buy/Sell futures, options, or currencies. No representation is being made that any account will or is likely to achieve profits or losses similar to those discussed on this web site. The past performance of any trading system or methodology is not necessarily indicative of future results.
CFTC RULE 4.41 –HYPOTHETICAL OR SIMULATED PERFORMANCE RESULTS HAVE CERTAIN LIMITATIONS. UNLIKE AN ACTUAL PERFORMANCE RECORD, SIMULATED RESULTS DO NOT REPRESENT ACTUAL TRADING. ALSO, SINCE THE TRADES HAVE NOT BEEN EXECUTED, THE RESULTS MAY HAVE UNDER-OR-OVER COMPENSATED FOR THE IMPACT, IF ANY, OF CERTAIN MARKET FACTORS, SUCH AS LACK OF LIQUIDITY. SIMULATED TRADING PROGRAMS IN GENERAL ARE ALSO SUBJECT TO THE FACT THAT THEY ARE DESIGNED WITH THE BENEFIT OF HINDSIGHT. NO REPRESENTATION IS BEING MADE THAT ANY ACCOUNT WILL OR IS LIKELY TO ACHIEVE PROFIT OR LOSSES SIMILAR TO THOSE SHOWN