
Markets (Top Stories)
 Get ready for the first Fed meeting of the year. The latest monetary policy announcement from the Federal Open Market Committee will be released at 2:00 PM ET, and many are keeping a watchful eye on the decision that influences mortgages, credit cards and business expansion plans. However, with the central bank likely to hold rates steady for a fourth straight meeting, investors will be focused on tweaks to the language in the Fed’s statement and on Chair Jerome Powell’s post-decision press conference.
Source: SeekingAlpha.com
Economic Calendar
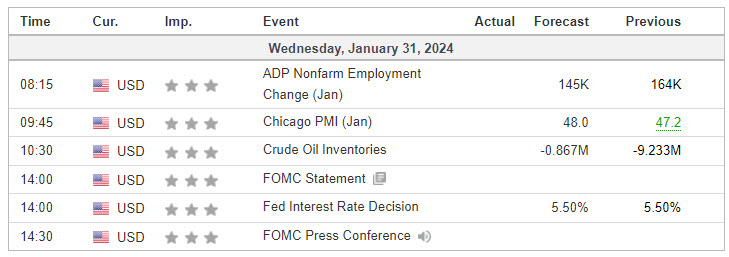
https://www.investing.com/economic-calendar/

S&P 500

***Written for contribution to MrTopStep’s “The Opening Print” publication.
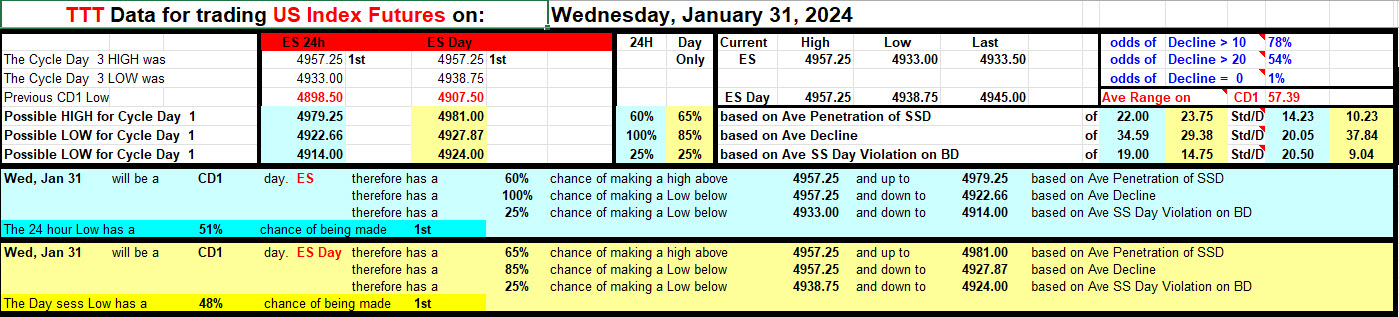
Prior Session was Cycle Day 3 (CD3): Having fulfilled 3 Day Cycle objectives, price failed to extend gains, consolidating throughout the session. After hours tech earnings release has the e-mini (ES) futures trading down to key 4930 level. Prior range was 24 handles on 1.077M contracts exchanged.
…Transition from Cycle Day 3 to Cycle Day 1
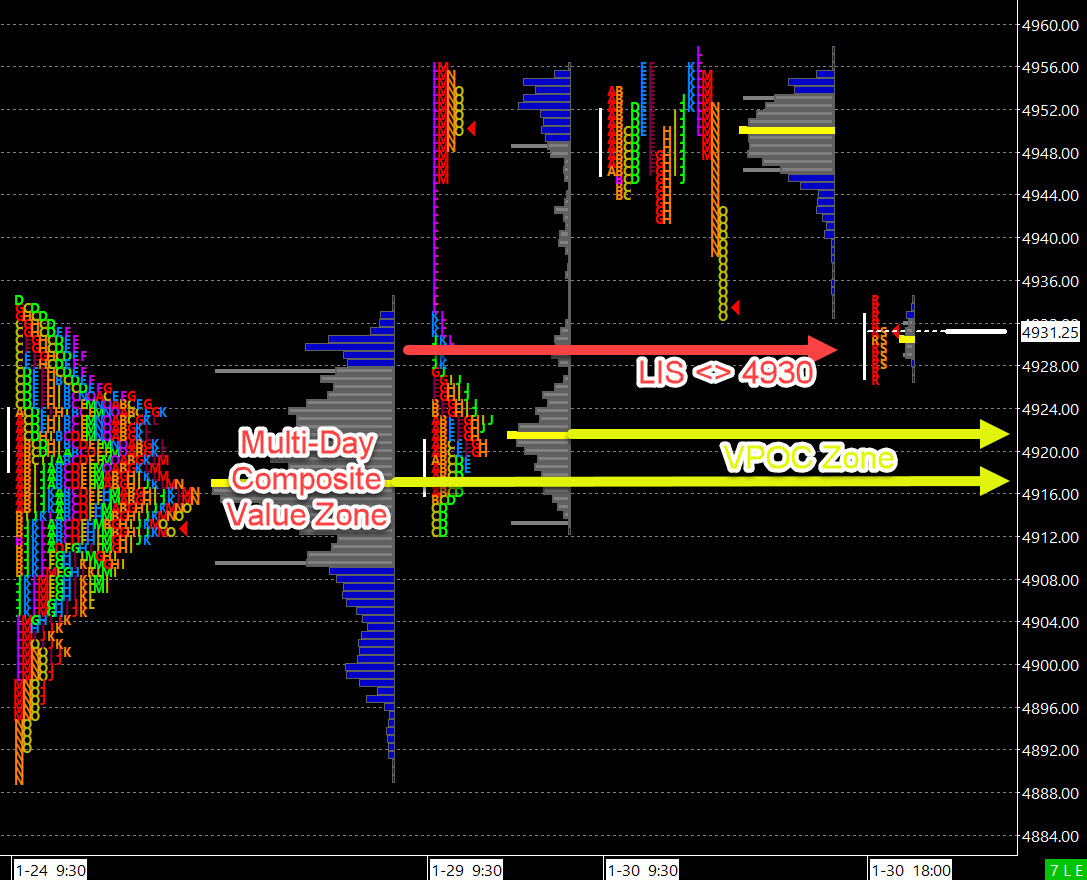
This leads us into Cycle Day 1 (CD1): Average Decline Zone for CD1 measures between 4927 – 4922. Overnight trade activity has fulfilled the 4927 level as traders react to post close tech earnings and prepare for the FED DAY Statement and Presser. We’ll mark 4930 as today’s Line-In-Sand (LIS) as this level represents the breakout from multi-day composite range. (see chart image). Our daily plan remains unchanged. Stay flexible and in-alignment with the primary intra-day forces. As such, scenarios to consider for today’s trading.
Bull Scenario: Price sustains a bid above 4930, initially targets 4945 – 4950 zone.
Bear Scenario: Price sustains an offer below 4930, initially targets 4915 – 4905 zone.
PVA High Edge = 4953 PVA Low Edge = 4946 Prior POC = 4948
*****The 3 Day Cycle has a 91% probability of fulfilling Positive Cycle Statistics covering 12 years of recorded tracking history.
For more detailed information for both bullish and bearish projected targets, please visit: PTG 3 Day Cycle and/or reference the Cycle Spreadsheet below:
Link to access full Cycle Spreadsheet > > Cycle Day 1 (CD1)
Range Projections and Key Levels (ES) March 2024 (H) Contract
HOD ATR Range Projection: 4969; LOD ATR Range Projection: 4891; 3 Day Central Pivot: 4930; 3 Day Cycle Target: 4968; 10 Day Average True Range 42; VIX: 13
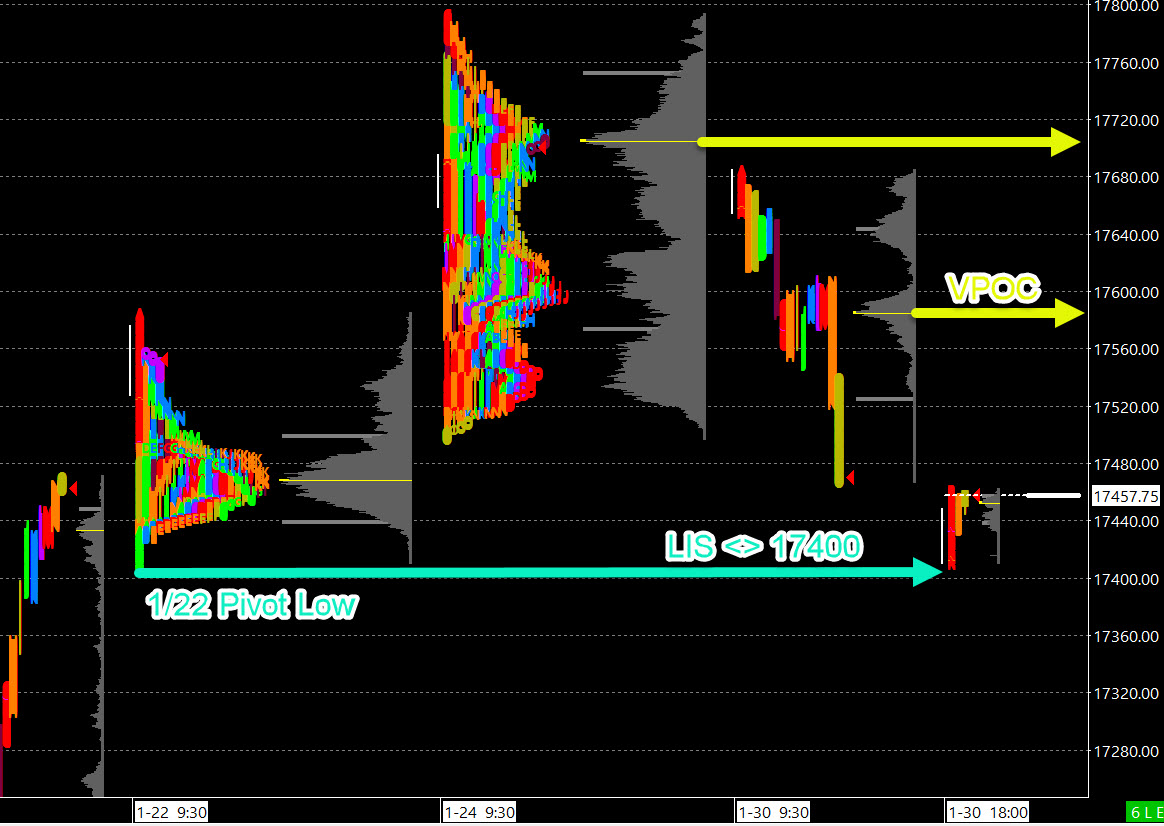
Nasdaq 100 (NQ)

Prior Session was Cycle Day 3 (CD3): Having fulfilled 3 Day Cycle objectives, price failed to extend gains, consolidating throughout the session. After hours tech earnings (AMD; GOOGL; MFST, TSLA) release has the (NQ) futures trading down to key 17400 level. Prior range was 268 handles on 546k contracts exchanged.
…Transition from Cycle Day 3 to Cycle Day 1
This leads us into Cycle Day 1 (CD1): Average Decline Zone for CD1 measures between 17560 – 17535 which has been exceeded on post-close tech earnings. Next big event will be FED DAY Statement and Presser. We’ll mark 17400 as today’s Line-In-Sand (LIS) as this level represents the key pivot low from 1/22. Our daily plan remains unchanged. Stay flexible and in-alignment with the primary intra-day forces. As such, scenarios to consider for today’s trading.
Bull Scenario: Price sustains a bid above 17400, initially targets 17530 – 17560 zone.
Bear Scenario: Price sustains an offer below 17400, initially targets 17360 – 17320 zone.
PVA High Edge = 17657 PVA Low Edge = 17527 Prior POC = 17584
Range Projections and Key Levels (NQ) March 2024 (H) Contract
HOD ATR Range Projection: 17651; LOD ATR Range Projection: 17220; 3 Day Central Pivot: 17572; 3 Day Cycle Target: 17728; 10 Day Average True Range: 241; VIX: 13
Trade Strategy: Our tactical trade strategy will simply remain unaltered…We’ll be flexible to trade both long and short side from Decision Pivot Levels. Continue to focus on Bull/Bear Stackers and Premium/Discounts. As always, remaining in alignment with dominant intra-day force increases probabilities of producing winning trades.
Stay Focused…Non-Biased…Disciplined ALWAYS USE STOPS!
Good Trading…David
“Knowing is not enough, We must APPLY. Willing is not enough, We must DO.” –Bruce Lee
*****This trade strategy report is disseminated for “education only” and should not be viewed in any way as a recommendation to buy or sell futures products.”
PAST PERFORMANCE IS NOT NECESSARILY INDICATIVE OF FUTURE RESULTS
IMPORTANT NOTICE! No representation is being made that the use of this strategy or any system or trading methodology will generate profits. Past performance is not necessarily indicative of future results. There is substantial risk of loss associated with trading securities and options on equities. Only risk capital should be used to trade. Trading securities is not suitable for everyone.
Disclaimer: Futures, Options, and Currency trading all have large potential rewards, but they also have large potential risk. You must be aware of the risks and be willing to accept them in order to invest in these markets. Don’t trade with money you can’t afford to lose.
This website is neither a solicitation nor an offer to Buy/Sell futures, options, or currencies. No representation is being made that any account will or is likely to achieve profits or losses similar to those discussed on this web site. The past performance of any trading system or methodology is not necessarily indicative of future results.
CFTC RULE 4.41 –HYPOTHETICAL OR SIMULATED PERFORMANCE RESULTS HAVE CERTAIN LIMITATIONS. UNLIKE AN ACTUAL PERFORMANCE RECORD, SIMULATED RESULTS DO NOT REPRESENT ACTUAL TRADING. ALSO, SINCE THE TRADES HAVE NOT BEEN EXECUTED, THE RESULTS MAY HAVE UNDER-OR-OVER COMPENSATED FOR THE IMPACT, IF ANY, OF CERTAIN MARKET FACTORS, SUCH AS LACK OF LIQUIDITY. SIMULATED TRADING PROGRAMS IN GENERAL ARE ALSO SUBJECT TO THE FACT THAT THEY ARE DESIGNED WITH THE BENEFIT OF HINDSIGHT. NO REPRESENTATION IS BEING MADE THAT ANY ACCOUNT WILL OR IS LIKELY TO ACHIEVE PROFIT OR LOSSES SIMILAR TO THOSE SHOWN