
Markets
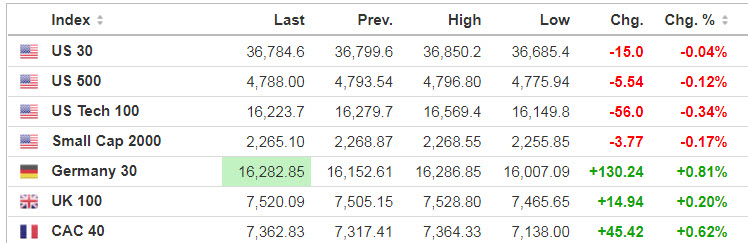
Source: SeekingAlpha.com
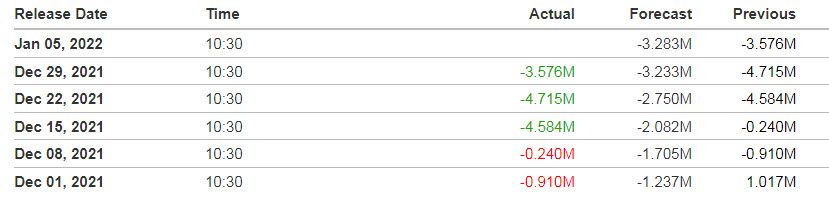
Economic Calendar
8:15 ADP Jobs Report
9:45 PMI Composite Final
2:00 PM FOMC Minutes
https://www.investing.com/economic-calendar/
***New: PTG Trading Room Chat Log’s Link

10:30 EIA Petroleum Inventories
S&P 500

***Written Tuesday evening for Wednesday’s trading for contribution to MrTopStep’s “The Opening Print” publication.
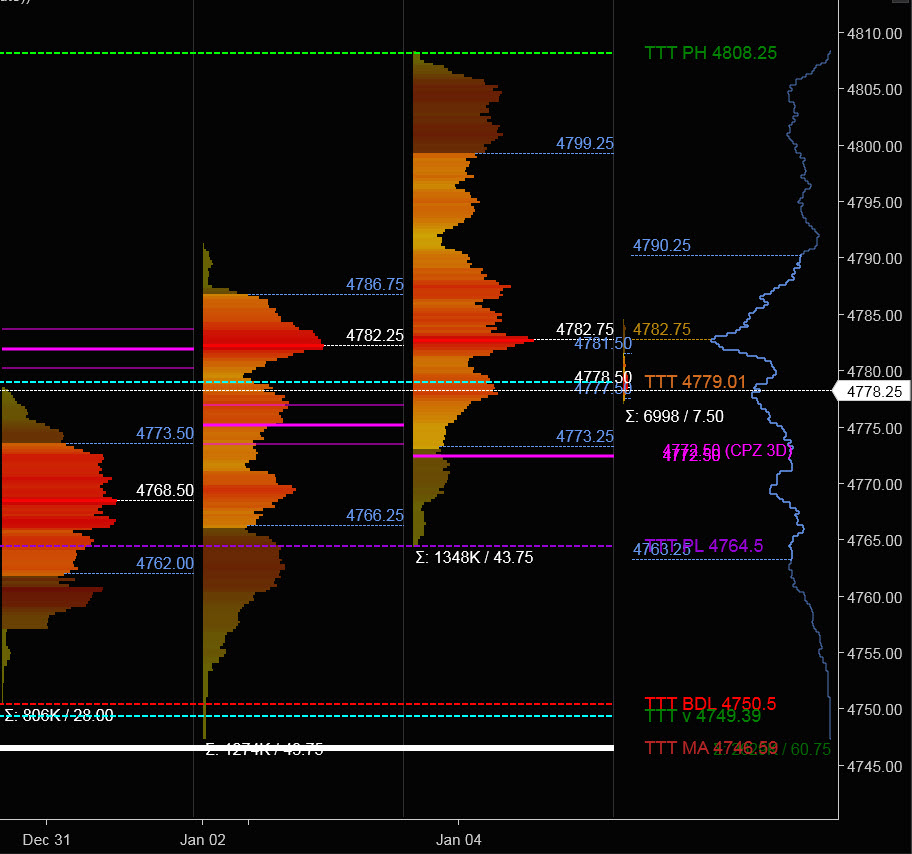
Prior Session was Cycle Day 3 (CD3): Price initially pushed higher during GLOBEX fulfilling Penetration Level (4803), but failed to hold bid during RTH, reversing direction on violation of Line In The Sand (4790). Sell-down found buyers at Large Gamma Level 2 (4764), bouncing back to (LIS) 4790, settling at POC (4783) Range was 44 handles on 1347M contracts exchanged.
…Transition from Cycle Day 3 to Cycle Day 1
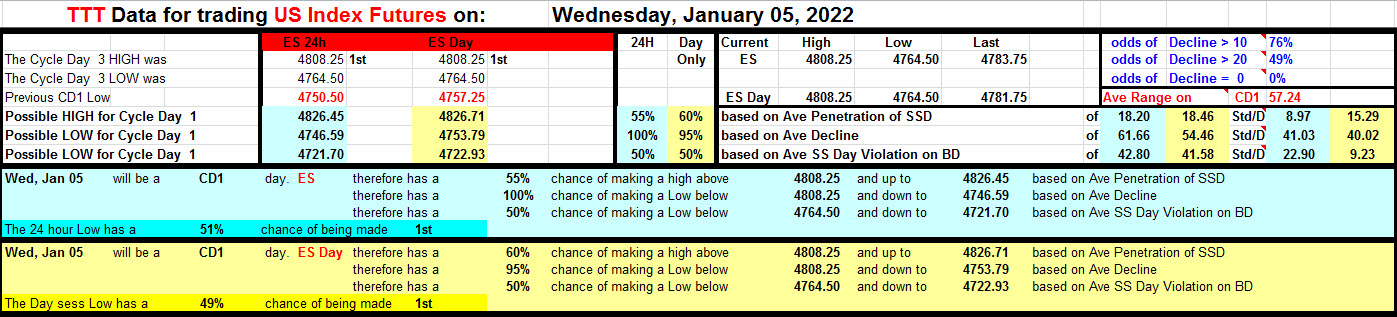
This leads us into Cycle Day 1 (CD1): Average CD1 Decline measures 4747. So with prior session selling, approximately 75% of this range has been fulfilled. Should selling momentum spill over into today’s session, expectation would be for normal CD1 targets to be achieved. As such, estimated scenarios to consider for today’s trading.
1.) Price sustains a bid above 4783, initially targets 4795 – 4800 zone.
2.) Price sustains an offer below 4783, initially targets 4765 – 4760 zone.
*****The 3 Day Cycle has a 91% probability of fulfilling Positive Cycle Statistics covering 12 years of recorded tracking history.
For more detailed information for both bullish and bearish projected targets, please visit: PTG 3 Day Cycle and/or reference the Cycle Spreadsheet below:
Link to access full Cycle Spreadsheet > > Cycle Day 1 (CD1)
PVA High Edge = 4799 PVA Low Edge = 4773 Prior POC = 4783
Range Projections and Key Levels (ES) March 2022 (H) Contract
HOD ATR Range Projection: 4814; LOD ATR Range Projection: 4740; 3 Day Central Pivot: 4775; 3 Day Cycle Target: 4802; 10 Day Average True Range 47; VIX: 17
Nasdaq 100 (NQ)

Today is Cycle Day 1 (CD1)…Average Decline for CD1 measures 16253, which has been fulfilled during prior session. Should selling spill over into today’s session, lower downside targets measure 16140 down through 16094. Prior range was 425 handles on 662k contracts exchanged. As such, there are two estimated scenarios to consider for today’s trading.
Bull Scenario: IF Bulls sustain a bid above 16200, THEN initial upside estimate targets 16250 – 16300 zone.
Bear Scenario: IF Bears sustain an offer below 16200, THEN initial downside estimate targets 16170 – 16150 zone.
PVA High Edge = 16385 PVA Low Edge = 16142 Prior POC = 16200
Range Projections and Key Levels (NQ) March 2022 (H) Contract
HOD ATR Range Projection: 16422; LOD ATR Range Projection: 16018; 3 Day Central Pivot: 16375; 3 Day Cycle Target: 16564; 10 Day Average True Range: 250; VIX: 17

Trade Strategy: Our tactical trade strategy will simply remain unaltered…We’ll be flexible to trade both long and short side from Decision Pivot Levels. Continue to focus on Bull/Bear Stackers and Premium/Discounts. As always, remaining in alignment with dominant intra-day force increases probabilities of producing winning trades.
Stay Focused…Non-Biased…Disciplined ALWAYS USE STOPS!
Good Trading…David
“Knowing is not enough, We must APPLY. Willing is not enough, We must DO.” –Bruce Lee
*****This trade strategy report is disseminated for “education only” and should not be viewed in any way as a recommendation to buy or sell futures products.”
PAST PERFORMANCE IS NOT NECESSARILY INDICATIVE OF FUTURE RESULTS
IMPORTANT NOTICE! No representation is being made that the use of this strategy or any system or trading methodology will generate profits. Past performance is not necessarily indicative of future results. There is substantial risk of loss associated with trading securities and options on equities. Only risk capital should be used to trade. Trading securities is not suitable for everyone.
Disclaimer: Futures, Options, and Currency trading all have large potential rewards, but they also have large potential risk. You must be aware of the risks and be willing to accept them in order to invest in these markets. Don’t trade with money you can’t afford to lose.
This website is neither a solicitation nor an offer to Buy/Sell futures, options, or currencies. No representation is being made that any account will or is likely to achieve profits or losses similar to those discussed on this web site. The past performance of any trading system or methodology is not necessarily indicative of future results.
CFTC RULE 4.41 –HYPOTHETICAL OR SIMULATED PERFORMANCE RESULTS HAVE CERTAIN LIMITATIONS. UNLIKE AN ACTUAL PERFORMANCE RECORD, SIMULATED RESULTS DO NOT REPRESENT ACTUAL TRADING. ALSO, SINCE THE TRADES HAVE NOT BEEN EXECUTED, THE RESULTS MAY HAVE UNDER-OR-OVER COMPENSATED FOR THE IMPACT, IF ANY, OF CERTAIN MARKET FACTORS, SUCH AS LACK OF LIQUIDITY. SIMULATED TRADING PROGRAMS IN GENERAL ARE ALSO SUBJECT TO THE FACT THAT THEY ARE DESIGNED WITH THE BENEFIT OF HINDSIGHT. NO REPRESENTATION IS BEING MADE THAT ANY ACCOUNT WILL OR IS LIKELY TO ACHIEVE PROFIT OR LOSSES SIMILAR TO THOSE SHOWN