
Markets
Day (or night) traders are having a field day as headlines grab hold of market sentiment. While U.S. stocks rallied Wednesday on trade optimism, futures fell sharply after the close on reports that high-level trade talks between the U.S. and China – scheduled for today and tomorrow in Washington – might be cut short. A volatile session then ensued, with futures now back at the starting line.
In Asia, Japan +0.5%. Hong Kong +0.1%. China +0.8%. India -0.8%.
In Europe, at midday, London -0.1%. Paris +0.4%. Frankfurt +0.1%.
Futures at 6:20, Dow flat. S&P flat. Nasdaq flat. Crude -0.6% to $52.28. Gold flat at $1512.90. Bitcoin +3.7% to $8501.
Ten-year Treasury Yield unchanged at 1.59%
Source: Seeking Alpha https://seekingalpha.com
Economic Calendar
8:30Initial Jobless Claims
8:30Consumer Price Index
10:30EIA Natural Gas Inventory
12:15 PMFed’s Kashkari Speech
12:30 PMFed’s Daly Speech
1:00 PMResults of $16B, 30-Year Note Auction
2:00 PMTreasury Budget
3:30 PMFed’s Daly Speech
4:30 PMMoney Supply
4:30 PMFed Balance Sheet
5:30 PMFed’s Mester Speech
https://www.investing.com/economic-calendar/
***PTG Trading Room Chat Log’s Link
S&P 500
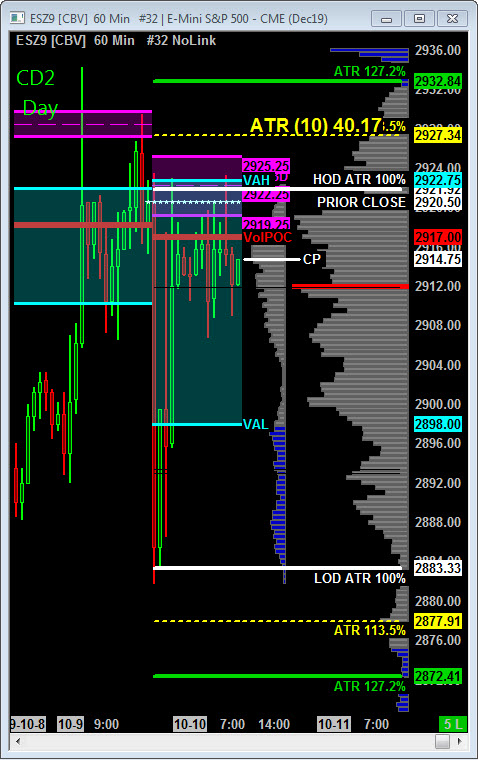
Today is Cycle Day 2 (CD2)…This cycle’s minimum rally objective is currently in-place. Bulls will need to convert the 3 Day Central Pivot Zone (2919 – 2925) to upper support to extend rally to higher projections.
3 Day Cycle Lesson: Cycle Day 2 is typically a “pause-day” IF there has been an initial rally off the CD1 Low. This allows for some balancing of long/short positions before expectation of rally continuation. Note: IF on a CD2 price opens on gap down below the CD1 Low, THEN odds still favor a rally back to recover above the violated low.
*****ANNOUNCEMENT: PTG Trader Tool Box Indicator & Strategy Suite is now available for NinjaTrader 8 trading platform.
*****The 3 Day Cycle Spreadsheet which subscribers receive shortly after market close for next trading session contains all the projected range targets. Here is link to web page to learn more: https://polaristradinggroup.com/ptg-3-day-cycle/
CD2 Range High = 2929.50 CD2 Range Low = 2975.75 CD2 Range Avg = 47.75
Scenario 1: IF Bulls hold bid above 2912, THEN initial upside potential targets 2920 – 2925 zone.
Scenario 2: IF Bears hold offer below 2912, THEN initial downside objective targets 2905 – 2898 zone.
Range Projections and Key Levels (ES) December 2019 (Z) Contract
HOD ATR Range Projection: 2922.00; LOD ATR Range Projection: 2833.00; 3 Day Central Pivot: 2922.00; 3 Day Cycle Target: 2939.00; 10 Day Average True Range 40.17: VIX: 19.58
Nasdaq 100 (NQ)
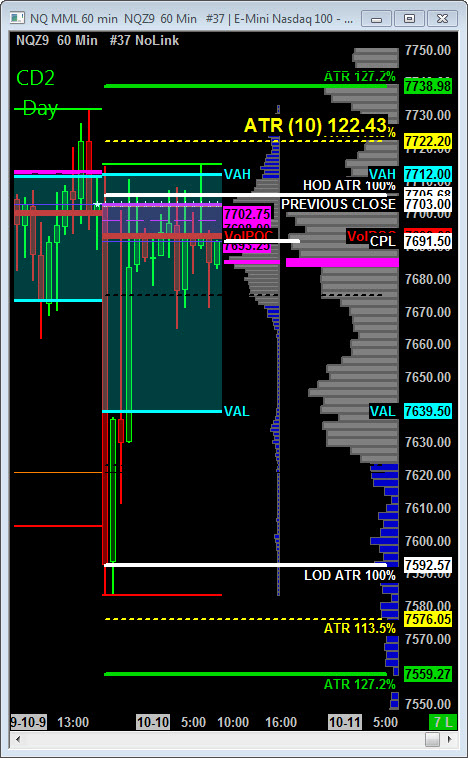
Today is Cycle Day 2 (CD2)…Expectation is for some “back n fill” balancing to consolidate recent sell down and rally recovery back to 5-day POC zone. Continuation of current upside off CD1 Low would unfold IF upper support created above 7720 – 7725 zone.
CD2 Range High = 7742.75 CD2 Range Low = 7755.50 CD2 Range Avg = 159.50
Scenario 1: IF Bulls hold bid above 7693, THEN initial upside potential targets 7715 – 7732 zone.
Scenario 2: IF Bears hold offer below 7693, THEN initial downside objective targets 7665 – 7639 zone.
Range Projections and Key Levels (NQ) December 2019 (Z) Contract
HOD ATR Range Projection: 7705.50; LOD ATR Range Projection: 7592.50; 3 Day Central Pivot: 7698.00; 3 Day Cycle Target: 7772.75; 10 Day Average True Range: 122.43; VIX: 19.58
Trade Strategy: Our tactical trade strategy will simply remain unaltered…We’ll be flexible to trade both long and short side from Decision Pivot Levels. Continue to focus on Bull/Bear Stackers and Premium/Discounts. As always, remaining in alignment with dominant intra-day force increases probabilities of producing winning trades.
Stay Focused…Non-Biased…Disciplined ALWAYS USE STOPS!
Good Trading…David
“Knowing is not enough, We must APPLY. Willing is not enough, We must DO.” –Bruce Lee
*****This trade strategy report is disseminated for “education only” and should not be viewed in any way as a recommendation to buy or sell futures products.”
PAST PERFORMANCE IS NOT NECESSARILY INDICATIVE OF FUTURE RESULTS
IMPORTANT NOTICE! No representation is being made that the use of this strategy or any system or trading methodology will generate profits. Past performance is not necessarily indicative of future results. There is substantial risk of loss associated with trading securities and options on equities. Only risk capital should be used to trade. Trading securities is not suitable for everyone.
Disclaimer: Futures, Options, and Currency trading all have large potential rewards, but they also have large potential risk. You must be aware of the risks and be willing to accept them in order to invest in these markets. Don’t trade with money you can’t afford to lose.
This website is neither a solicitation nor an offer to Buy/Sell futures, options, or currencies. No representation is being made that any account will or is likely to achieve profits or losses similar to those discussed on this web site. The past performance of any trading system or methodology is not necessarily indicative of future results.
CFTC RULE 4.41 –HYPOTHETICAL OR SIMULATED PERFORMANCE RESULTS HAVE CERTAIN LIMITATIONS. UNLIKE AN ACTUAL PERFORMANCE RECORD, SIMULATED RESULTS DO NOT REPRESENT ACTUAL TRADING. ALSO, SINCE THE TRADES HAVE NOT BEEN EXECUTED, THE RESULTS MAY HAVE UNDER-OR-OVER COMPENSATED FOR THE IMPACT, IF ANY, OF CERTAIN MARKET FACTORS, SUCH AS LACK OF LIQUIDITY. SIMULATED TRADING PROGRAMS IN GENERAL ARE ALSO SUBJECT TO THE FACT THAT THEY ARE DESIGNED WITH THE BENEFIT OF HINDSIGHT. NO REPRESENTATION IS BEING MADE THAT ANY ACCOUNT WILL OR IS LIKELY TO ACHIEVE PROFIT OR LOSSES SIMILAR TO THOSE SHOWN