
Markets (Top Stories)
 Yields Surge
Treasuries sold off sharply early Tuesday after Sept. retail sales figures came in much stronger than expected, while Wall Street’s major averages ended near the flatline. The 10-year Treasury yield (US10Y) jumped to as high as 4.84% on Tuesday, while the 2-year yield (US2Y) rose to 5.22%. See how yields are trading across the curve.
Source: SeekingAlpha.com
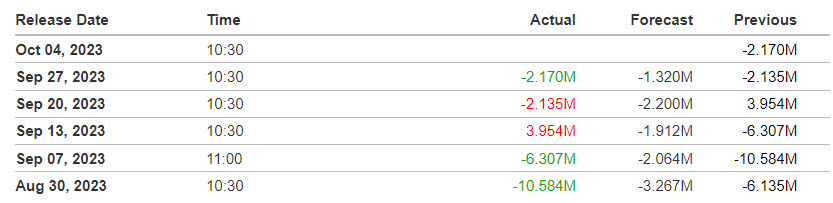
Economic Calendar
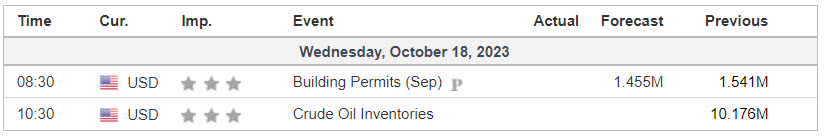
https://www.investing.com/economic-calendar/

S&P 500

***Written Tuesday evening for Wednesday’s trading for contribution to MrTopStep’s “The Opening Print” publication.
Prior Session was Cycle Day 2 (CD2): Price extended this cycle’s rally fulfilling 4417 – 4422 target zone as outlined in prior DTS 10.17.23 Briefing. Prior range was 57 handles on 1.824M contracts exchanged.
…Transition from Cycle Day 2 to Cycle Day 3
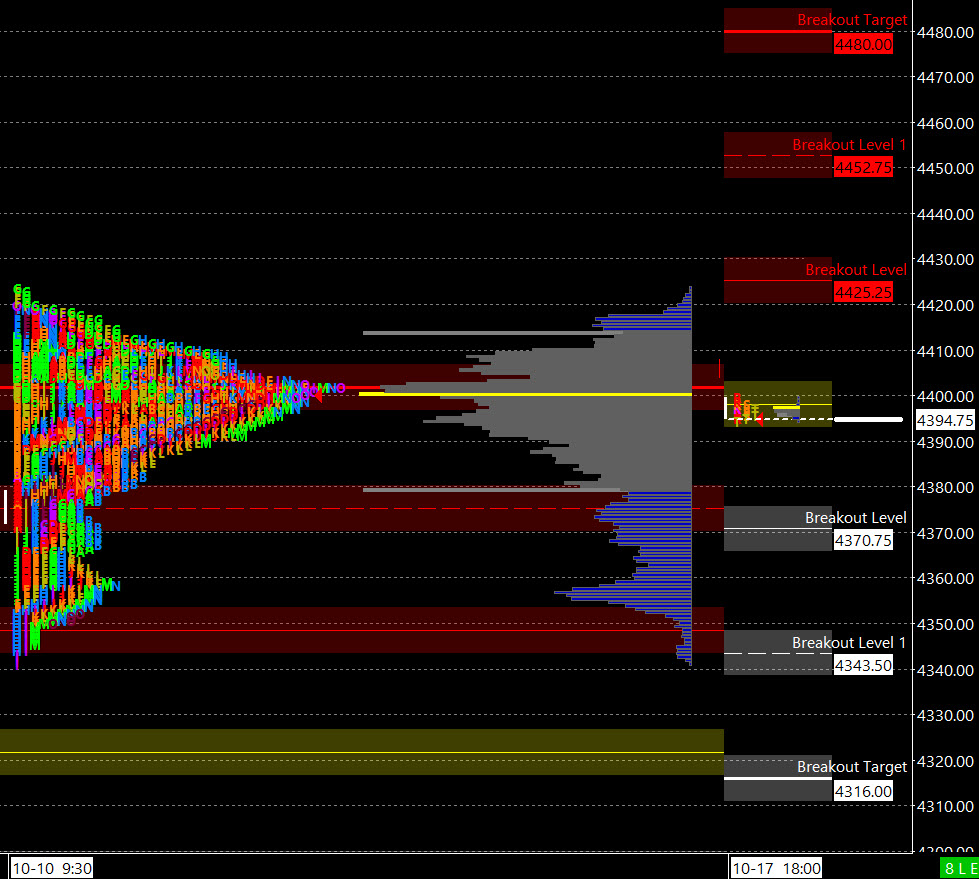
This leads us into Cycle Day 3 (CD3): Markets continue to consolidate within the five-day value zone marked by 4380 – 4415 “sandbox” edges. Three-Day Cycle Targets have been fulfilled, so we will mark today as a “wild-card” for direction, given price is trading near POC (4400) and balanced. Geo-Political turmoil is always a potential market-moving variable as “tape-bombs” can occur at any moment. As such, scenarios to consider for today’s trading.
Bull Scenario: Price sustains a bid above 4405, initially targets 4420 – 4425 zone.
Bear Scenario: Price sustains an offer below 4395, initially targets 4380 – 4375 zone.
PVA High Edge = 4410 PVA Low Edge = 4383 Prior POC = 4395
*****The 3 Day Cycle has a 91% probability of fulfilling Positive Cycle Statistics covering 12 years of recorded tracking history.
For more detailed information for both bullish and bearish projected targets, please visit: PTG 3 Day Cycle and/or reference the Cycle Spreadsheet below:
Link to access full Cycle Spreadsheet > > Cycle Day 3 (CD3)
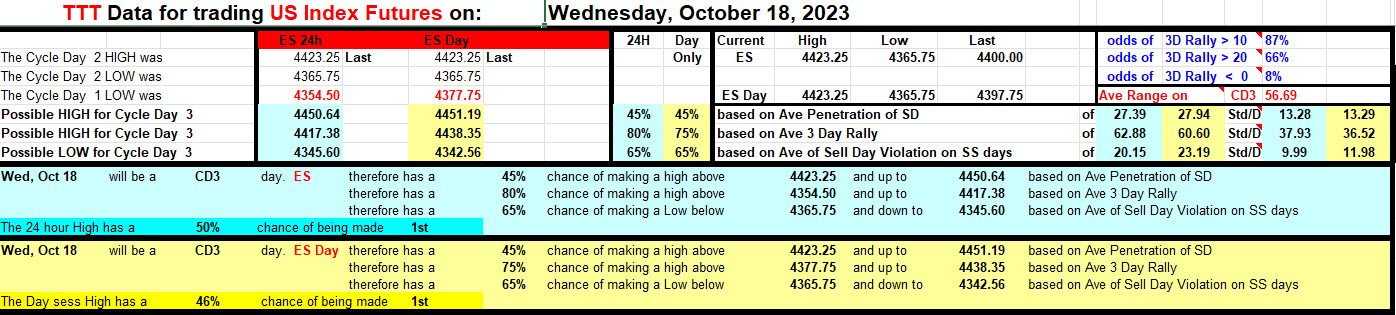
Range Projections and Key Levels (ES) December 2023 (Z) Contract
HOD ATR Range Projection: 4461; LOD ATR Range Projection: 4333; 3 Day Central Pivot: 4385; 3 Day Cycle Target: 4317; 10 Day Average True Range 65; VIX: 17
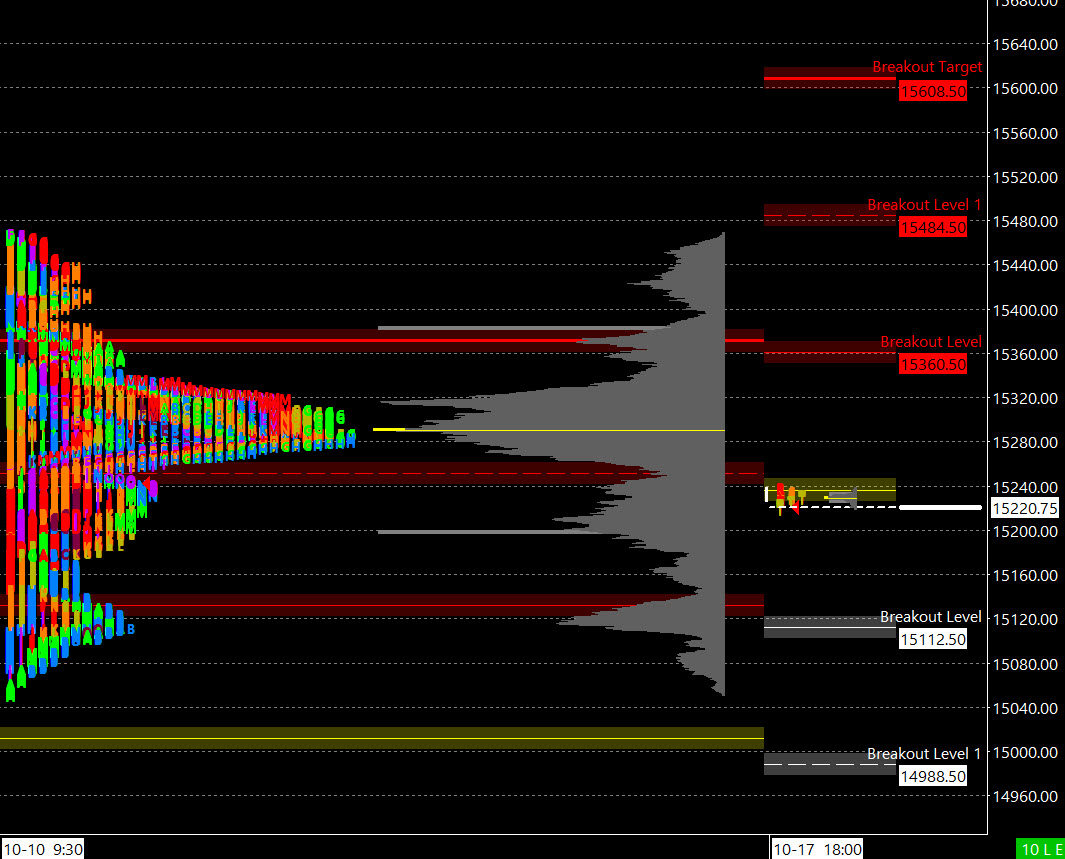
Nasdaq 100 (NQ)

Prior Session was Cycle Day 2 (CD2): Price extended this cycle’s rally fulfilling 15305 Target Master Zone. Prior range was 259 handles on 773k contracts exchanged.
…Transition from Cycle Day 2 to Cycle Day 3
This leads us into Cycle Day 3 (CD3): Markets continue to consolidate within wide five-day value zone marked by 15200 – 15400 “sandbox” edges. Three-Day Cycle Targets have been fulfilled, so we will mark today as a “wild-card” for direction, given price is trading near lower quartile of 5-day value zone. Political turmoil is always a potential market-moving variable as “tape-bombs” can occur at any moment. As such, scenarios to consider for today’s trading.
Bull Scenario: Price sustains a bid above 15245, initially targets 15340 – 15365 zone.
Bear Scenario: Price sustains an offer below 15225, initially targets 15140 – 15115 zone.
PVA High Edge = 15289 PVA Low Edge = 15178 Prior POC = 15208
Range Projections and Key Levels (NQ) December 2023 (Z) Contract
HOD ATR Range Projection: 15500; LOD ATR Range Projection: 14956; 3 Day Central Pivot: 15207; 3 Day Cycle Target: 15376; 10 Day Average True Range: 282; VIX: 17
Trade Strategy: Our tactical trade strategy will simply remain unaltered…We’ll be flexible to trade both long and short side from Decision Pivot Levels. Continue to focus on Bull/Bear Stackers and Premium/Discounts. As always, remaining in alignment with dominant intra-day force increases probabilities of producing winning trades.
Stay Focused…Non-Biased…Disciplined ALWAYS USE STOPS!
Good Trading…David
“Knowing is not enough, We must APPLY. Willing is not enough, We must DO.” –Bruce Lee
*****This trade strategy report is disseminated for “education only” and should not be viewed in any way as a recommendation to buy or sell futures products.”
PAST PERFORMANCE IS NOT NECESSARILY INDICATIVE OF FUTURE RESULTS
IMPORTANT NOTICE! No representation is being made that the use of this strategy or any system or trading methodology will generate profits. Past performance is not necessarily indicative of future results. There is substantial risk of loss associated with trading securities and options on equities. Only risk capital should be used to trade. Trading securities is not suitable for everyone.
Disclaimer: Futures, Options, and Currency trading all have large potential rewards, but they also have large potential risk. You must be aware of the risks and be willing to accept them in order to invest in these markets. Don’t trade with money you can’t afford to lose.
This website is neither a solicitation nor an offer to Buy/Sell futures, options, or currencies. No representation is being made that any account will or is likely to achieve profits or losses similar to those discussed on this web site. The past performance of any trading system or methodology is not necessarily indicative of future results.
CFTC RULE 4.41 –HYPOTHETICAL OR SIMULATED PERFORMANCE RESULTS HAVE CERTAIN LIMITATIONS. UNLIKE AN ACTUAL PERFORMANCE RECORD, SIMULATED RESULTS DO NOT REPRESENT ACTUAL TRADING. ALSO, SINCE THE TRADES HAVE NOT BEEN EXECUTED, THE RESULTS MAY HAVE UNDER-OR-OVER COMPENSATED FOR THE IMPACT, IF ANY, OF CERTAIN MARKET FACTORS, SUCH AS LACK OF LIQUIDITY. SIMULATED TRADING PROGRAMS IN GENERAL ARE ALSO SUBJECT TO THE FACT THAT THEY ARE DESIGNED WITH THE BENEFIT OF HINDSIGHT. NO REPRESENTATION IS BEING MADE THAT ANY ACCOUNT WILL OR IS LIKELY TO ACHIEVE PROFIT OR LOSSES SIMILAR TO THOSE SHOWN