
Markets
Markets are still on edge following data that showed U.S. factory activity shrinking in September to its weakest level since 2009, ratcheting up fears that the U.S.-China trade war is hobbling the world’s largest economy. The weak print saw the Dow drop nearly 350 points yesterday – with another 173-point loss likely at the open – while stocks flashed red across Europe and Asia overnight. Wall Street’s next focus is this morning’s ADP private payrolls report, which will give further clues about the labor market and broader economy ahead of the government’s monthly jobs report on Friday.
Billions of dollars were wiped off the market values of top stock-trading platforms on Tuesday as Charles Schwab (NYSE:SCHW) intensified a price war by scrapping trading fees. “We don’t want to fall into the trap that a myriad of other firms in a variety of industries have fallen into, and wait too long to respond to new entrants,” said CFO Peter Crawford. Movement: TD Ameritrade (NASDAQ:AMTD) plunged 25%, E*Trade (NASDAQ:ETFC) sunk 16%, Interactive Brokers (IEX:IBKR) fell 9% and Charles Schwab declined 10%.
In Asia, Japan -0.5%. Hong Kong -0.2%. China closed. India closed.
In Europe, at midday, London -1.7%. Paris -1.5%. Frankfurt -1.2%.
Futures at 6:20, Dow -0.7%. S&P -0.7%. Nasdaq -0.8%. Crude +0.2% to $53.74. Gold +0.1% to $1489.70. Bitcoin -1.1% to $8252.
Ten-year Treasury Yield -2 bps to 1.62%
Source: Seeking Alpha https://seekingalpha.com
Economic Calendar
8:15ADP Jobs Report
9:00Fed’s Harker Speech
10:30EIA Petroleum Inventories
10:50Fed’s Williams Speech
https://www.investing.com/economic-calendar/
***PTG Trading Room Chat Log’s Link
S&P 500
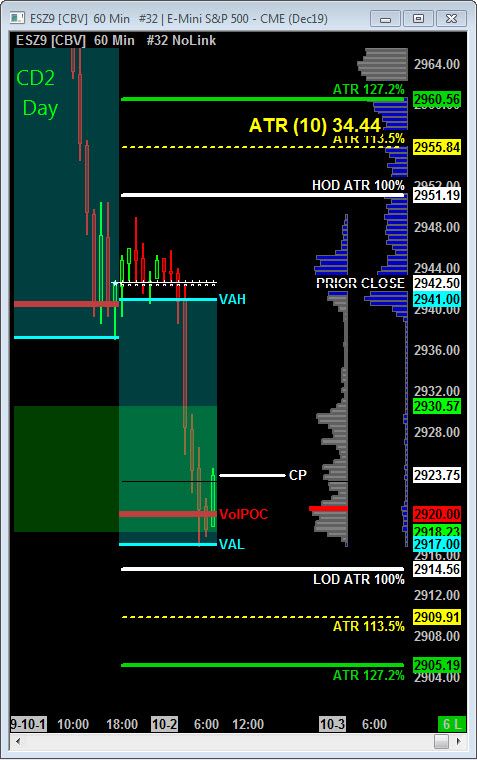
Today is Cycle Day 2 (CD2)…Price violated prior session’s low (2937) and has extended down into 2924 – 2918 Cycle Day 2 Statistical Violation Zone. Further downside targets measure 2910 – 2905. Bulls need to recover above 2930 handle to squelch the selling.
*****ANNOUNCEMENT: PTG Trader Tool Box Indicator & Strategy Suite is now available for NinjaTrader 8 trading platform.
*****The 3 Day Cycle Spreadsheet which subscribers receive shortly after market close for next trading session contains all the projected range targets. Here is link to web page to learn more: https://polaristradinggroup.com/ptg-3-day-cycle/
CD2 Range High = 2941.00 CD2 Range Low = 2905.00 CD2 Range Avg = 45.00
Scenario 1: IF Bulls hold bid above 2920, THEN initial upside potential targets 2930 – 2937 zone.
Scenario 2: IF Bears hold offer below 2920, THEN initial downside objective targets 2910 – 2905 zone.
Range Projections and Key Levels (ES) December 2019 (Z) Contract
HOD ATR Range Projection: 2951.00; LOD ATR Range Projection: 2915.00; 3 Day Central Pivot: 2980.00; 3 Day Cycle Target: 2966.00; 10 Day Average True Range 34.44: VIX: 19.61
Nasdaq 100 (NQ)
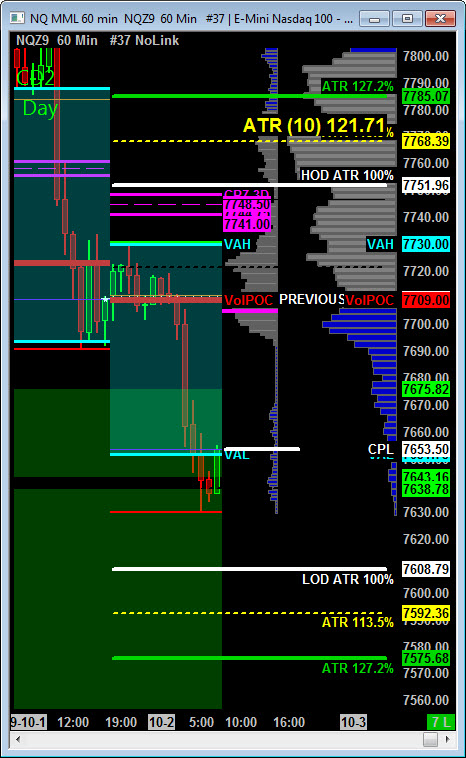
Today is Cycle Day 2 (CD2)…Price violated prior session’s low (7691) and has extended down into 7659.50 – 7643.50 Cycle Day 2 Statistical Violation Zone. Further downside targets measure 7608 – 7592. Bulls need to recover above 7680 handle to squelch the selling.
CD2 Range High = 7690.00 CD2 Range Low = 7577.00 CD2 Range Avg = 153.00
Scenario 1: IF Bulls hold bid above 7650, THEN initial upside potential targets 7675 – 7690 zone.
Scenario 2: IF Bears hold offer below 7650, THEN initial downside objective targets 7630 – 7608 zone.
Range Projections and Key Levels (NQ) December 2019 (Z) Contract
HOD ATR Range Projection: 7752.00; LOD ATR Range Projection: 7608.00; 3 Day Central Pivot: 7745.00; 3 Day Cycle Target: 7763.00; 10 Day Average True Range: 122.00; VIX: 19.61
Trade Strategy: Our tactical trade strategy will simply remain unaltered…We’ll be flexible to trade both long and short side from Decision Pivot Levels. Continue to focus on Bull/Bear Stackers and Premium/Discounts. As always, remaining in alignment with dominant intra-day force increases probabilities of producing winning trades.
Stay Focused…Non-Biased…Disciplined ALWAYS USE STOPS!
Good Trading…David
“Knowing is not enough, We must APPLY. Willing is not enough, We must DO.” –Bruce Lee
*****This trade strategy report is disseminated for “education only” and should not be viewed in any way as a recommendation to buy or sell futures products.”
PAST PERFORMANCE IS NOT NECESSARILY INDICATIVE OF FUTURE RESULTS
IMPORTANT NOTICE! No representation is being made that the use of this strategy or any system or trading methodology will generate profits. Past performance is not necessarily indicative of future results. There is substantial risk of loss associated with trading securities and options on equities. Only risk capital should be used to trade. Trading securities is not suitable for everyone.
Disclaimer: Futures, Options, and Currency trading all have large potential rewards, but they also have large potential risk. You must be aware of the risks and be willing to accept them in order to invest in these markets. Don’t trade with money you can’t afford to lose.
This website is neither a solicitation nor an offer to Buy/Sell futures, options, or currencies. No representation is being made that any account will or is likely to achieve profits or losses similar to those discussed on this web site. The past performance of any trading system or methodology is not necessarily indicative of future results.
CFTC RULE 4.41 –HYPOTHETICAL OR SIMULATED PERFORMANCE RESULTS HAVE CERTAIN LIMITATIONS. UNLIKE AN ACTUAL PERFORMANCE RECORD, SIMULATED RESULTS DO NOT REPRESENT ACTUAL TRADING. ALSO, SINCE THE TRADES HAVE NOT BEEN EXECUTED, THE RESULTS MAY HAVE UNDER-OR-OVER COMPENSATED FOR THE IMPACT, IF ANY, OF CERTAIN MARKET FACTORS, SUCH AS LACK OF LIQUIDITY. SIMULATED TRADING PROGRAMS IN GENERAL ARE ALSO SUBJECT TO THE FACT THAT THEY ARE DESIGNED WITH THE BENEFIT OF HINDSIGHT. NO REPRESENTATION IS BEING MADE THAT ANY ACCOUNT WILL OR IS LIKELY TO ACHIEVE PROFIT OR LOSSES SIMILAR TO THOSE SHOWN