
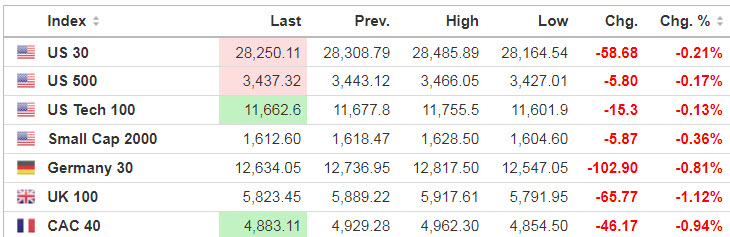
Markets

U.S. stock index futures are hugging the flatline with traders in wait-and-see mode as coronavirus aid negotiations continue to drag along.
Source: SeekingAlpha.com
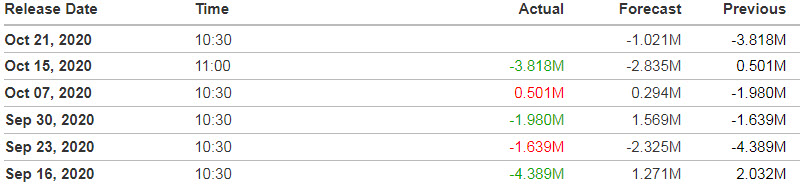
Economic Calendar
10:30 EIA Petroleum Inventories

https://www.investing.com/economic-calendar/
***New: PTG Trading Room Chat Log’s Link
S&P 500

***Written 8 pm Tuesday evening for Wednesday’s trading for contribution to MrTopStep’s “The Opening Print” publication
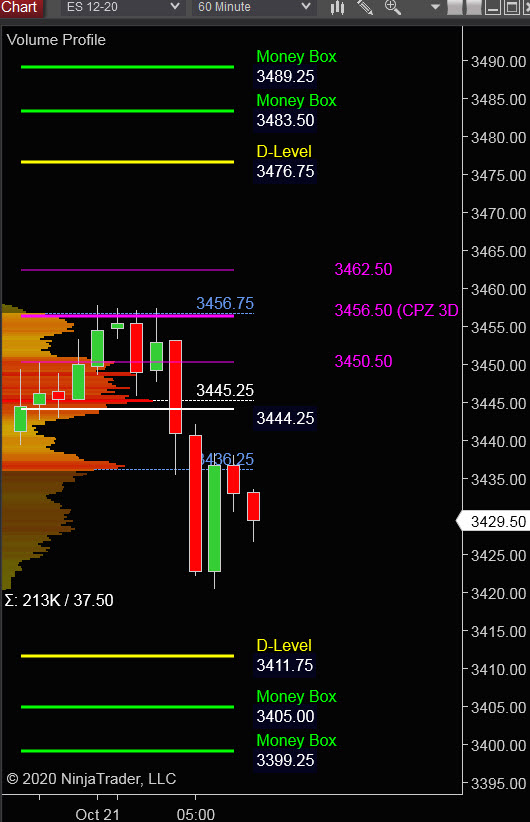
Tuesday’s Session was Cycle Day 3 (CD3): Similar action to previous cycle in that price was well below CD1 Low at beginning of session, and rallied throughout to reclaim 3461.25, securing a Positive 3 Day Cycle Statistic. It’s important to note the odds (91%) favor a positive cycle by the end of CD3. Range was 51 handles on 1.682M contracts exchanged.
…Transition from Cycle Day 3 to Cycle Day 1
This leads us into Cycle Day 1 (CD1): Majority of this cycle’s decline from CD3 High (3469.75) down to CD1 Average Decline (3415) is in-place. As such, there are two scenarios to consider for today’s trading.
1.) Price sustains a bid above 3435, initially targets 3455 – 3470 zone.
2.) Price sustains an offer below 3435, initially targets 3425 – 3415 zone.
*****3 Day Cycle has a 91% probability of fulfilling Positive Statistic covering 12 years of recorded tracking history.
PVA High Edge = 3450 PVA Low Edge = 3431 Prior POC = 3435
Range Projections and Key Levels (ES) December 2020 (Z) Contract
HOD ATR Range Projection: 3472; LOD ATR Range Projection: 3416; 3 Day Central Pivot: 3456; 3 Day Cycle Target: 3453; 10 Day Average True Range 54; VIX: 30
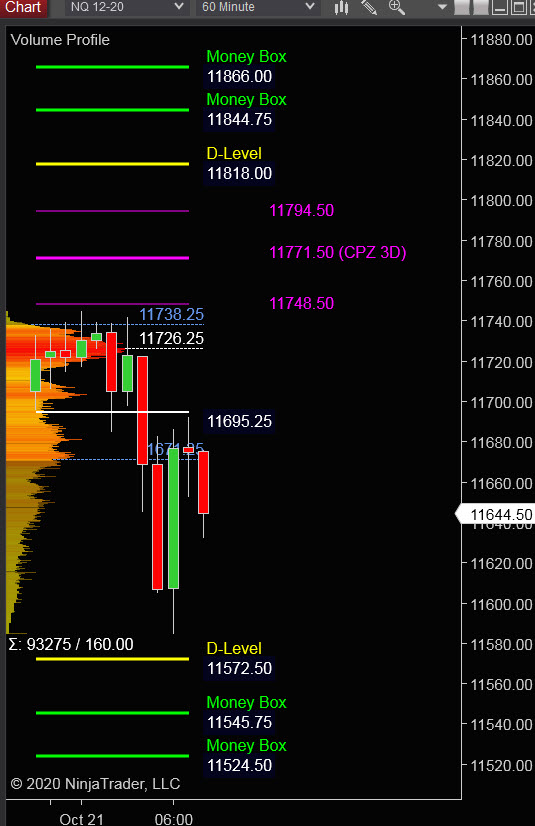
Nasdaq 100 (NQ)

Today is Cycle Day 1 (CD1)…Normal for CD1 is decline with average measuring 11518 handle. For today’s trading, there are two scenarios to consider.
PVA High Edge = 11726 PVA Low Edge = 11645 Prior POC = 11680
Bull Scenario: IF Bulls sustain a bid above 11680, THEN initial upside estimate targets 11745 – 11770 zone.
Bear Scenario: IF Bears sustain an offer below 11680, THEN initial downside estimate targets 11585 – 11518 zone.
Range Projections and Key Levels (NQ) December 2020 (Z) Contract
HOD ATR Range Projection: 11825; LOD ATR Range Projection: 11505; 3 Day Central Pivot: 11770; 3 Day Cycle Target: 11675; 10 Day Average True Range: 240; VIX: 30
Trade Strategy: Our tactical trade strategy will simply remain unaltered…We’ll be flexible to trade both long and short side from Decision Pivot Levels. Continue to focus on Bull/Bear Stackers and Premium/Discounts. As always, remaining in alignment with dominant intra-day force increases probabilities of producing winning trades.
Stay Focused…Non-Biased…Disciplined ALWAYS USE STOPS!
Good Trading…David
“Knowing is not enough, We must APPLY. Willing is not enough, We must DO.” –Bruce Lee
*****This trade strategy report is disseminated for “education only” and should not be viewed in any way as a recommendation to buy or sell futures products.”
PAST PERFORMANCE IS NOT NECESSARILY INDICATIVE OF FUTURE RESULTS
IMPORTANT NOTICE! No representation is being made that the use of this strategy or any system or trading methodology will generate profits. Past performance is not necessarily indicative of future results. There is substantial risk of loss associated with trading securities and options on equities. Only risk capital should be used to trade. Trading securities is not suitable for everyone.
Disclaimer: Futures, Options, and Currency trading all have large potential rewards, but they also have large potential risk. You must be aware of the risks and be willing to accept them in order to invest in these markets. Don’t trade with money you can’t afford to lose.
This website is neither a solicitation nor an offer to Buy/Sell futures, options, or currencies. No representation is being made that any account will or is likely to achieve profits or losses similar to those discussed on this web site. The past performance of any trading system or methodology is not necessarily indicative of future results.
CFTC RULE 4.41 –HYPOTHETICAL OR SIMULATED PERFORMANCE RESULTS HAVE CERTAIN LIMITATIONS. UNLIKE AN ACTUAL PERFORMANCE RECORD, SIMULATED RESULTS DO NOT REPRESENT ACTUAL TRADING. ALSO, SINCE THE TRADES HAVE NOT BEEN EXECUTED, THE RESULTS MAY HAVE UNDER-OR-OVER COMPENSATED FOR THE IMPACT, IF ANY, OF CERTAIN MARKET FACTORS, SUCH AS LACK OF LIQUIDITY. SIMULATED TRADING PROGRAMS IN GENERAL ARE ALSO SUBJECT TO THE FACT THAT THEY ARE DESIGNED WITH THE BENEFIT OF HINDSIGHT. NO REPRESENTATION IS BEING MADE THAT ANY ACCOUNT WILL OR IS LIKELY TO ACHIEVE PROFIT OR LOSSES SIMILAR TO THOSE SHOWN