
Markets

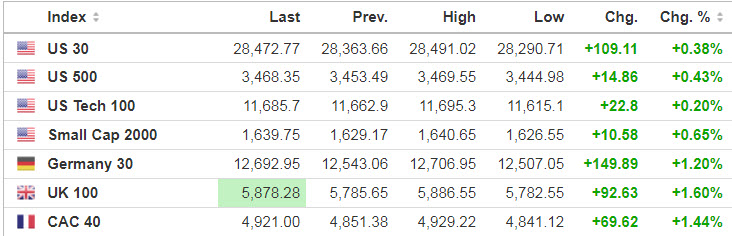
It’s been quite a choppy trading week on Wall Street, and that trend didn’t stop overnight, with U.S. stock index futures inching into the green after spending the first half of session in the red.
Source: SeekingAlpha.com
Economic Calendar
9:45 PMI Composite Flash
1:00 PM Baker-Hughes Rig Count
https://www.investing.com/economic-calendar/
***New: PTG Trading Room Chat Log’s Link
S&P 500

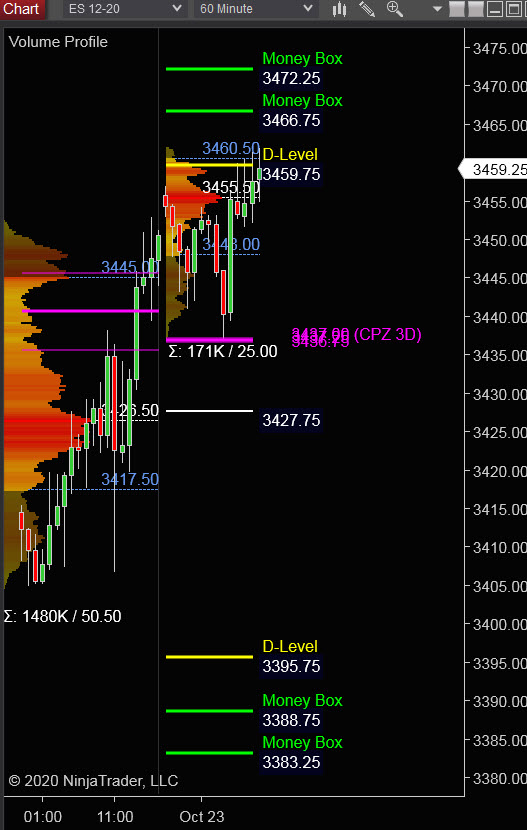
Prior Session was Cycle Day 2 (CD2): Roller coaster ride left traders weary at the end of trading, with no further clarity on stimulus talks. Range was 50.50 handles on 1.480M contracts exchanged.
…Transition from Cycle Day 2 to Cycle Day 3
This leads us into Cycle Day 3 (CD3): Price is currently above CD1 Low (3420.50) securing Positive 3 Day Cycle Statistic. Responsive buyers held back test of 3435 3 Day Central Pivot Support Zone. As such, there are two scenarios to consider for today’s trading.
1.) Price sustains a bid above 3455, initially targeting 3465 – 3470 zone.
2.) Price sustains an offer below 3455, initially targeting 3440 – 3435 zone.
*****3 Day Cycle has a 91% probability of fulfilling Positive Statistic covering 12 years of recorded tracking history.
PVA High Edge = 3445 PVA Low Edge = 3418 Prior POC = 3426
Range Projections and Key Levels (ES) December 2020 (Z) Contract
HOD ATR Range Projection: 3485; LOD ATR Range Projection: 3413; 3 Day Central Pivot: 3435; 3 Day Cycle Target: 3453; 10 Day Average True Range 49; VIX: 28
Nasdaq 100 (NQ)

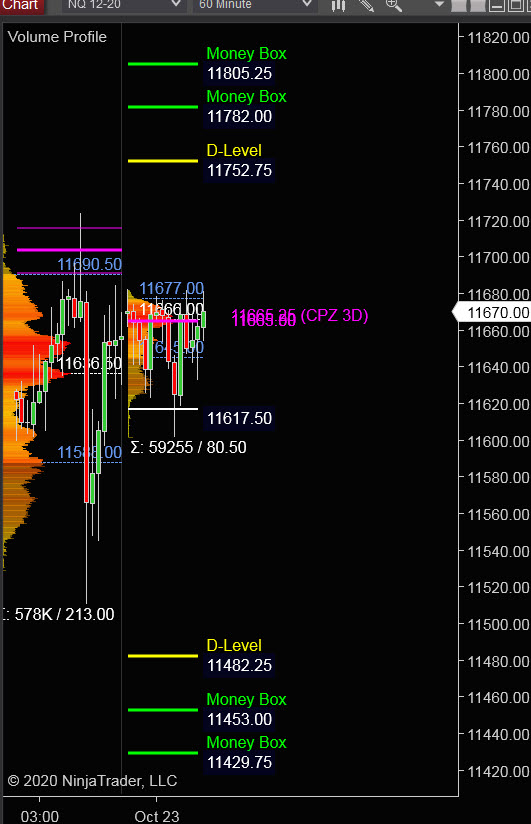
Today is Cycle Day 3 (CD3)…Positive 3 Day Cycle Statistic has been fulfilled, albeit in choppy fashion this cycle. As such, there are two scenarios to consider for today’s trading:
PVA High Edge = 11690 PVA Low Edge = 11588 Prior POC = 11637
Bull Scenario: IF Bulls sustain a bid above 11665, THEN initial upside estimate targets 11685 – 11690 zone.
Bear Scenario: IF Bears sustain an offer below 11665, THEN initial downside estimate targets 11645 – 11635 zone.
Range Projections and Key Levels (NQ) December 2020 (Z) Contract
HOD ATR Range Projection: 11845; LOD ATR Range Projection: 11439; 3 Day Central Pivot: 11665; 3 Day Cycle Target: 11675; 10 Day Average True Range: 243; VIX: 28
Trade Strategy: Our tactical trade strategy will simply remain unaltered…We’ll be flexible to trade both long and short side from Decision Pivot Levels. Continue to focus on Bull/Bear Stackers and Premium/Discounts. As always, remaining in alignment with dominant intra-day force increases probabilities of producing winning trades.
Stay Focused…Non-Biased…Disciplined ALWAYS USE STOPS!
Good Trading…David
“Knowing is not enough, We must APPLY. Willing is not enough, We must DO.” –Bruce Lee
*****This trade strategy report is disseminated for “education only” and should not be viewed in any way as a recommendation to buy or sell futures products.”
PAST PERFORMANCE IS NOT NECESSARILY INDICATIVE OF FUTURE RESULTS
IMPORTANT NOTICE! No representation is being made that the use of this strategy or any system or trading methodology will generate profits. Past performance is not necessarily indicative of future results. There is substantial risk of loss associated with trading securities and options on equities. Only risk capital should be used to trade. Trading securities is not suitable for everyone.
Disclaimer: Futures, Options, and Currency trading all have large potential rewards, but they also have large potential risk. You must be aware of the risks and be willing to accept them in order to invest in these markets. Don’t trade with money you can’t afford to lose.
This website is neither a solicitation nor an offer to Buy/Sell futures, options, or currencies. No representation is being made that any account will or is likely to achieve profits or losses similar to those discussed on this web site. The past performance of any trading system or methodology is not necessarily indicative of future results.
CFTC RULE 4.41 –HYPOTHETICAL OR SIMULATED PERFORMANCE RESULTS HAVE CERTAIN LIMITATIONS. UNLIKE AN ACTUAL PERFORMANCE RECORD, SIMULATED RESULTS DO NOT REPRESENT ACTUAL TRADING. ALSO, SINCE THE TRADES HAVE NOT BEEN EXECUTED, THE RESULTS MAY HAVE UNDER-OR-OVER COMPENSATED FOR THE IMPACT, IF ANY, OF CERTAIN MARKET FACTORS, SUCH AS LACK OF LIQUIDITY. SIMULATED TRADING PROGRAMS IN GENERAL ARE ALSO SUBJECT TO THE FACT THAT THEY ARE DESIGNED WITH THE BENEFIT OF HINDSIGHT. NO REPRESENTATION IS BEING MADE THAT ANY ACCOUNT WILL OR IS LIKELY TO ACHIEVE PROFIT OR LOSSES SIMILAR TO THOSE SHOWN