
Markets

The stakes this week couldn’t be higher as Big Tech gets ready to dominate earnings season. While third quarter reports will pour in from every corner of the market, results from Microsoft (MSFT), Alphabet (GOOGL), Meta (META), Apple (AAPL) and Amazon (AMZN) are likely to define investing direction for many a trader. Combined revenue growth of the newly found FAANG family, now called MAMAA by Mad Money‘s Jim Cramer, is expected to have slowed to just under 10%, compared to a 29% increase in 2021 that took sales to $1.4T.
Source: SeekingAlpha.com
Economic Calendar
8:30 Chicago Fed National Activity Index
9:45 PMI Composite Final
https://www.investing.com/economic-calendar/
***New: PTG Trading Room Chat Log’s Link
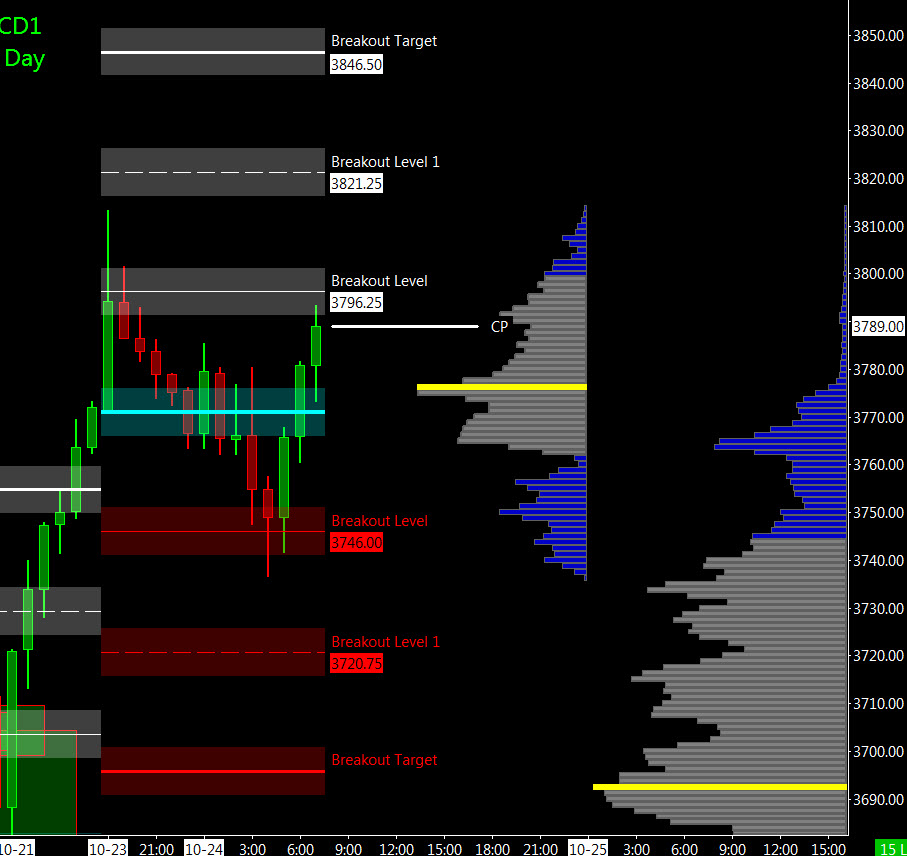
S&P 500

Prior Session was Cycle Day 3 (CD3): Positive 3-Day Cycle Statistic was fulfilled as price rallied surpassing cycle objectives. Prior range was 132 handles on 2.583M contracts exchanged.
…Transition from Cycle Day 3 to Cycle Day 1
This leads us into Cycle Day 1 (CD1): Average Decline for CD1 measures 3690.50. Normal for CD1 is a decline to find a new secure cycle low. Overnight buy response has developed near 3750 handle, so we’ll mark this level as “Key Structural Support.” As such, estimated scenarios to consider for today’s trading.
Bull Scenario: Price sustains a bid above 3750, initially targets 3790 – 3795 zone.
Bear Scenario: Price sustains an offer below 3750, initially targets 3720 – 3715 zone.
PVA High Edge = 3770 PVA Low Edge = 3688 Prior POC = 3765
Range Projections and Key Levels (ES) December 2022 (Z) Contract
HOD ATR Range Projection: 3832; LOD ATR Range Projection: 3716; 3 Day Central Pivot: 3715; 3 Day Cycle Target: 3834; 10 Day Average True Range 103; VIX: 30
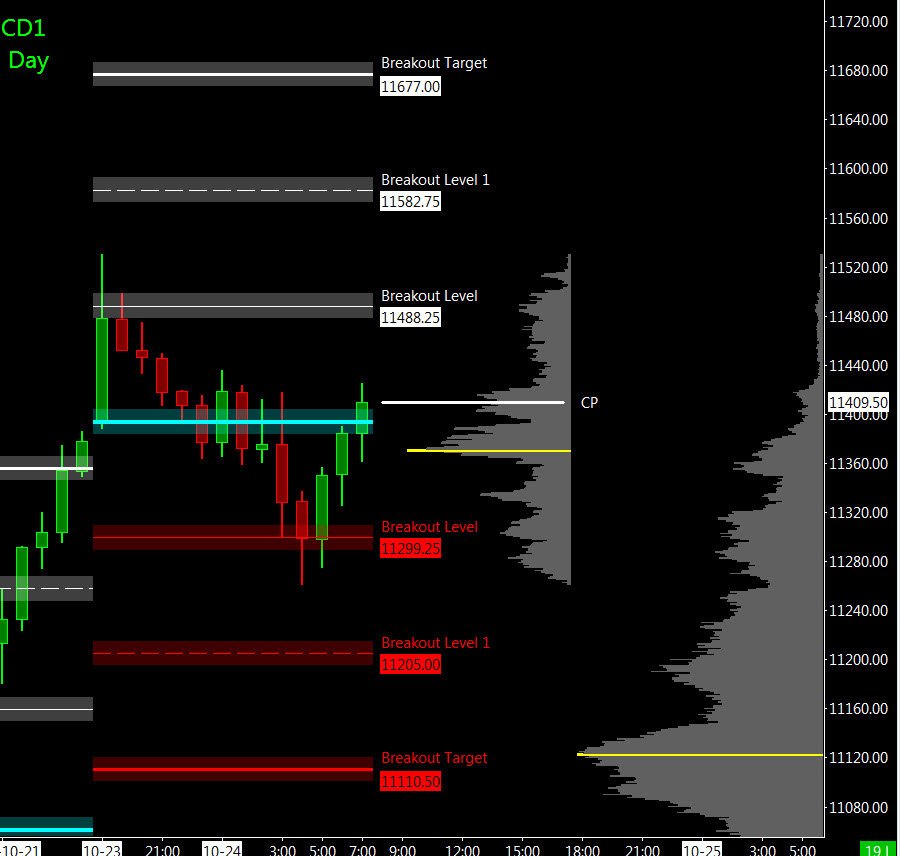
Nasdaq 100 (NQ)

Today is Cycle Day 1 (CD1)…Average Decline for CD1 measures 11063. Prior range was 450 handles on 826k contracts exchanged. As such, there are two estimated scenarios to consider for today’s trading.
Bull Scenario: IF Bulls sustains bid above 11300, THEN initial upside estimate targets 11425– 11455 zone.
Bear Scenario: IF Bears sustains offer below 11300, THEN initial downside estimate targets 11220 – 11205 zone.
PVA High Edge = 11381 PVA Low Edge = 11072 Prior POC = 11355
Range Projections and Key Levels (NQ) December 2022 (Z) Contract
HOD ATR Range Projection: 11606; LOD ATR Range Projection: 11185; 3 Day Central Pivot: 11187; 3 Day Cycle Target: 11632; 10 Day Average True Range: 378; VIX: 30
Trade Strategy: Our tactical trade strategy will simply remain unaltered…We’ll be flexible to trade both long and short side from Decision Pivot Levels. Continue to focus on Bull/Bear Stackers and Premium/Discounts. As always, remaining in alignment with dominant intra-day force increases probabilities of producing winning trades.
Stay Focused…Non-Biased…Disciplined ALWAYS USE STOPS!
Good Trading…David
“Knowing is not enough, We must APPLY. Willing is not enough, We must DO.” –Bruce Lee
*****This trade strategy report is disseminated for “education only” and should not be viewed in any way as a recommendation to buy or sell futures products.”
PAST PERFORMANCE IS NOT NECESSARILY INDICATIVE OF FUTURE RESULTS
IMPORTANT NOTICE! No representation is being made that the use of this strategy or any system or trading methodology will generate profits. Past performance is not necessarily indicative of future results. There is substantial risk of loss associated with trading securities and options on equities. Only risk capital should be used to trade. Trading securities is not suitable for everyone.
Disclaimer: Futures, Options, and Currency trading all have large potential rewards, but they also have large potential risk. You must be aware of the risks and be willing to accept them in order to invest in these markets. Don’t trade with money you can’t afford to lose.
This website is neither a solicitation nor an offer to Buy/Sell futures, options, or currencies. No representation is being made that any account will or is likely to achieve profits or losses similar to those discussed on this web site. The past performance of any trading system or methodology is not necessarily indicative of future results.
CFTC RULE 4.41 –HYPOTHETICAL OR SIMULATED PERFORMANCE RESULTS HAVE CERTAIN LIMITATIONS. UNLIKE AN ACTUAL PERFORMANCE RECORD, SIMULATED RESULTS DO NOT REPRESENT ACTUAL TRADING. ALSO, SINCE THE TRADES HAVE NOT BEEN EXECUTED, THE RESULTS MAY HAVE UNDER-OR-OVER COMPENSATED FOR THE IMPACT, IF ANY, OF CERTAIN MARKET FACTORS, SUCH AS LACK OF LIQUIDITY. SIMULATED TRADING PROGRAMS IN GENERAL ARE ALSO SUBJECT TO THE FACT THAT THEY ARE DESIGNED WITH THE BENEFIT OF HINDSIGHT. NO REPRESENTATION IS BEING MADE THAT ANY ACCOUNT WILL OR IS LIKELY TO ACHIEVE PROFIT OR LOSSES SIMILAR TO THOSE SHOWN