
Markets
Tech worries resurfaced after the bell on Tuesday after quarterly results from Alphabet and Microsoft dented the recent rally on Wall Street. Futures linked to the Nasdaq (COMP.IND) tumbled as much as 2.4% in overnight trading, while contracts tied to the S&P 500 (SP500) declined over 1%, challenging some who had already wagered that this year’s massive stock selloff had hit a bottom. Further volatility is inevitable as sentiment remains extremely fragile, while the wild market moves are making trading conditions all the more difficult.

Source: SeekingAlpha.com
Economic Calendar
8:30 Retail Inventories (Advance)
8:30 Wholesale Inventories (Advance)
10:00 New Home Sales
10:00 State Street Investor Confidence Index
11:00 Survey of Business Uncertainty
11:30 Results of $24B, 2-Year FRN Auction
1:00 PM Results of $43B, 5-Year Note Auction
https://www.investing.com/economic-calendar/
***New: PTG Trading Room Chat Log’s Link

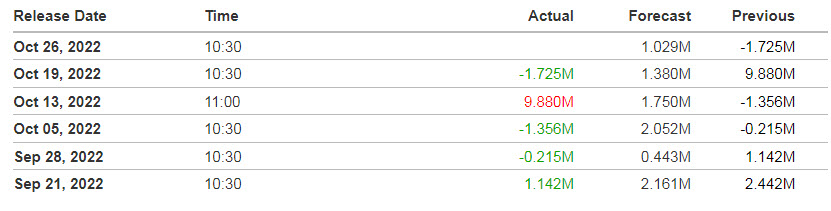
10:30 EIA Petroleum Inventories
S&P 500

***Written Tuesday evening for Wednesday’s trading for contribution to MrTopStep’s “The Opening Print” publication.
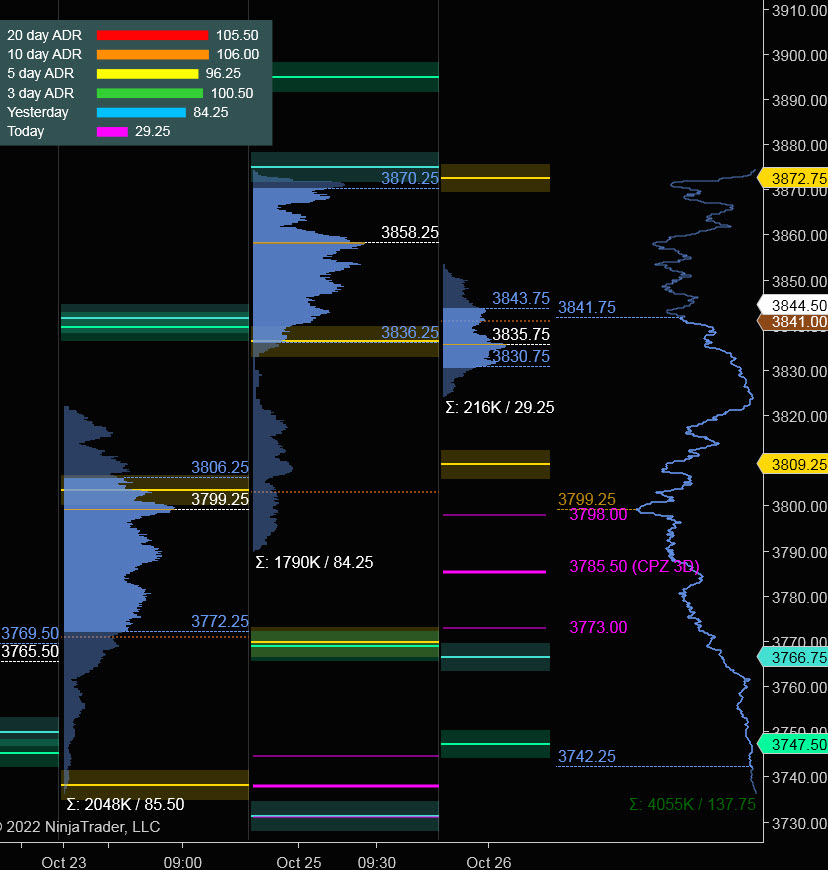
Prior Session was Cycle Day 2 (CD2): Markets continued to expand this cycle’s rally exceeding target objectives. Prior range was 84 handles on 1.790M contracts exchanged.
…Transition from Cycle Day 2 to Cycle Day 3
This leads us into Cycle Day 3 (CD3): Price has fulfilled this Cycle’s Target Objective and is currently trading below PH (3874.50). Bulls will need to continue the rally expansion above this level. Failure to clear and convert prior high (3874.25) may be the catalyst for the decline/pullback. As such, estimated scenarios to consider for today’s trading.
Bull Scenario: Price sustains a bid above 3850, initially targets 3870 – 3875 zone.
Bear Scenario: Price sustains an offer below 3850, initially targets 3825 – 3815 zone.
PVA High Edge = 3870 PVA Low Edge = 3840 Prior POC = 3858
*****The 3 Day Cycle has a 91% probability of fulfilling Positive Cycle Statistics covering 12 years of recorded tracking history.
For more detailed information for both bullish and bearish projected targets, please visit: PTG 3 Day Cycle and/or reference the Cycle Spreadsheet below:
Link to access full Cycle Spreadsheet > > Cycle Day 3 (CD3)
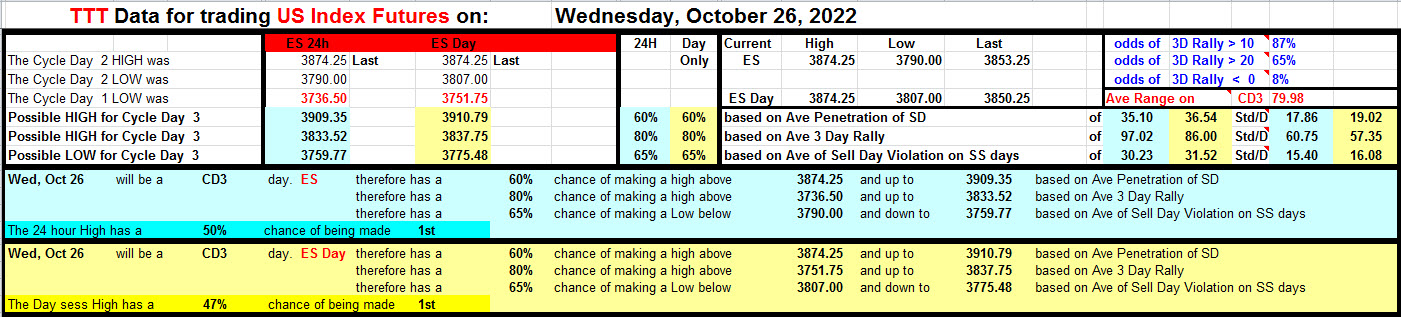
Range Projections and Key Levels (ES) December 2022 (Z) Contract
HOD ATR Range Projection: 3911; LOD ATR Range Projection: 3766; 3 Day Central Pivot: 3785; 3 Day Cycle Target: 3834; 10 Day Average True Range 106; VIX: 28
Nasdaq 100 (NQ)

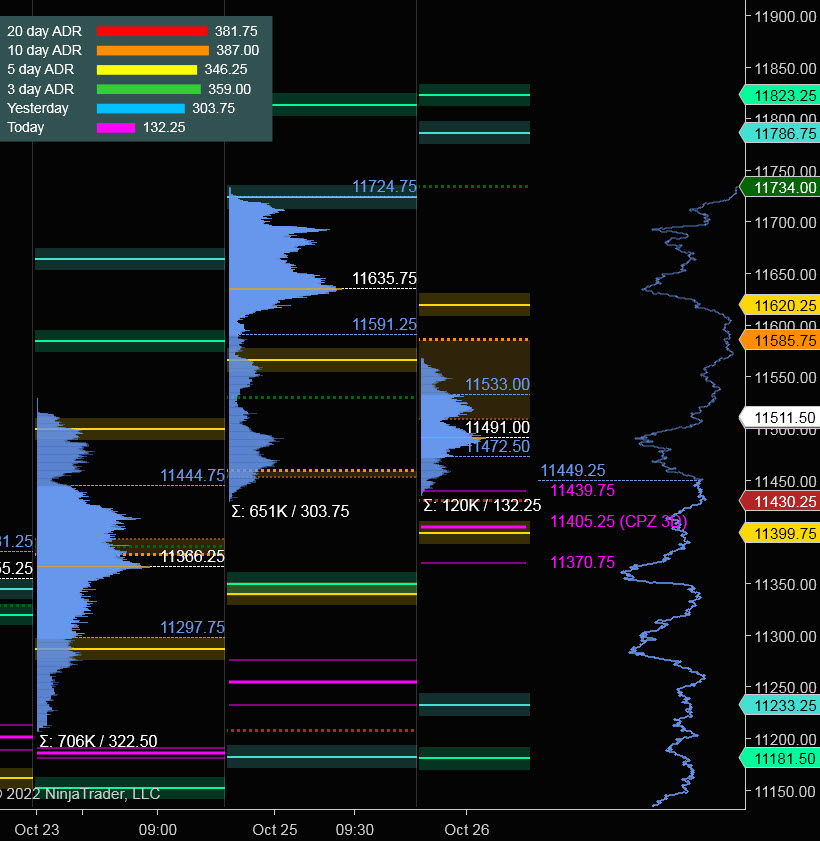
Today is Cycle Day 3 (CD3)…Three-Day Cycle Statistic was exceeded during prior session. Price is well above cycle objectives, so the next decline can begin at any time. Failure to clear and convert prior high (11734) may be the catalyst for a decline/pullback. As such, there are two estimated scenarios to consider for today’s trading.
Bull Scenario: IF Bulls sustains bid above 11500, THEN initial upside estimate targets 11640– 11680 zone.
Bear Scenario: IF Bears sustains offer below 11500, THEN initial downside estimate targets 11425 – 11365 zone.
PVA High Edge = 11725 PVA Low Edge = 11508 Prior POC = 11636
Range Projections and Key Levels (NQ) December 2022 (Z) Contract
HOD ATR Range Projection: 11758; LOD ATR Range Projection: 11247; 3 Day Central Pivot: 11405; 3 Day Cycle Target: 11580; 10 Day Average True Range: 383; VIX: 28
Trade Strategy: Our tactical trade strategy will simply remain unaltered…We’ll be flexible to trade both long and short side from Decision Pivot Levels. Continue to focus on Bull/Bear Stackers and Premium/Discounts. As always, remaining in alignment with dominant intra-day force increases probabilities of producing winning trades.
Stay Focused…Non-Biased…Disciplined ALWAYS USE STOPS!
Good Trading…David
“Knowing is not enough, We must APPLY. Willing is not enough, We must DO.” –Bruce Lee
*****This trade strategy report is disseminated for “education only” and should not be viewed in any way as a recommendation to buy or sell futures products.”
PAST PERFORMANCE IS NOT NECESSARILY INDICATIVE OF FUTURE RESULTS
IMPORTANT NOTICE! No representation is being made that the use of this strategy or any system or trading methodology will generate profits. Past performance is not necessarily indicative of future results. There is substantial risk of loss associated with trading securities and options on equities. Only risk capital should be used to trade. Trading securities is not suitable for everyone.
Disclaimer: Futures, Options, and Currency trading all have large potential rewards, but they also have large potential risk. You must be aware of the risks and be willing to accept them in order to invest in these markets. Don’t trade with money you can’t afford to lose.
This website is neither a solicitation nor an offer to Buy/Sell futures, options, or currencies. No representation is being made that any account will or is likely to achieve profits or losses similar to those discussed on this web site. The past performance of any trading system or methodology is not necessarily indicative of future results.
CFTC RULE 4.41 –HYPOTHETICAL OR SIMULATED PERFORMANCE RESULTS HAVE CERTAIN LIMITATIONS. UNLIKE AN ACTUAL PERFORMANCE RECORD, SIMULATED RESULTS DO NOT REPRESENT ACTUAL TRADING. ALSO, SINCE THE TRADES HAVE NOT BEEN EXECUTED, THE RESULTS MAY HAVE UNDER-OR-OVER COMPENSATED FOR THE IMPACT, IF ANY, OF CERTAIN MARKET FACTORS, SUCH AS LACK OF LIQUIDITY. SIMULATED TRADING PROGRAMS IN GENERAL ARE ALSO SUBJECT TO THE FACT THAT THEY ARE DESIGNED WITH THE BENEFIT OF HINDSIGHT. NO REPRESENTATION IS BEING MADE THAT ANY ACCOUNT WILL OR IS LIKELY TO ACHIEVE PROFIT OR LOSSES SIMILAR TO THOSE SHOWN