
Markets (Top Stories)
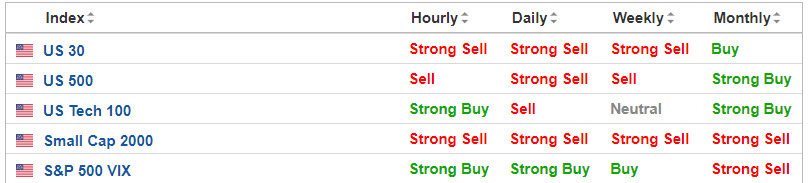
Source: SeekingAlpha.com
Economic Calendar
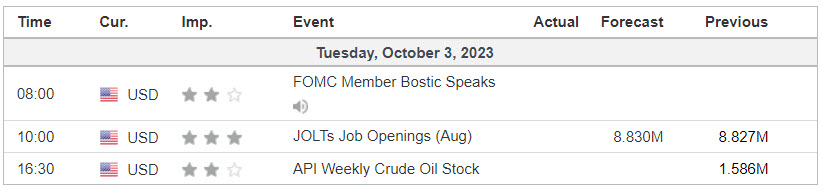
https://www.investing.com/economic-calendar/
S&P 500

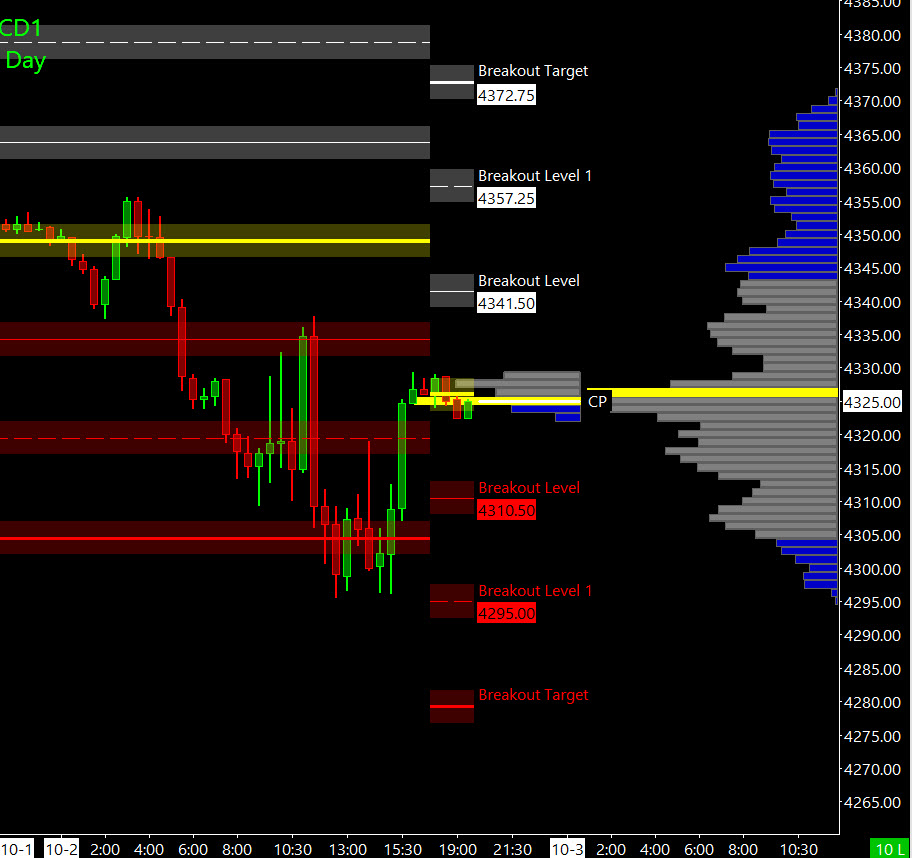
Prior Session was Cycle Day 3 (CD3): Positive Three-Day Cycle as price oscillated between 4290 – 4340 in a “balancing act” within multi-day value zone to begin the Fourth-Quarter. Prior range was 60 handles on 1.894M contracts exchanged.
…Transition from Cycle Day 3 to Cycle Day 1
This leads us into Cycle Day 1 (CD1): Average Decline measures 4321. Price continues to form a multi-day balancing value zone between 4290 – 4340. Not much has changed as trading transitions to the fourth-quarter, so we’ll continue to stay flexible and find short-term opportunities within value zone until the next directional breakout. As such, scenarios to consider for today’s trading.
Bull Scenario: Price sustains a bid above 4315, initially targets 4335 – 4340 zone.
Bear Scenario: Price sustains an offer below 4315, initially targets 4295 – 4290 zone.
PVA High Edge = 4328 PVA Low Edge = 4305 Prior POC = 4325
Range Projections and Key Levels (ES) December 2023 (Z) Contract
HOD ATR Range Projection: 4381; LOD ATR Range Projection: 4270; 3 Day Central Pivot: 4332; 3 Day Cycle Target: 4363; 10 Day Average True Range 59; VIX: 17
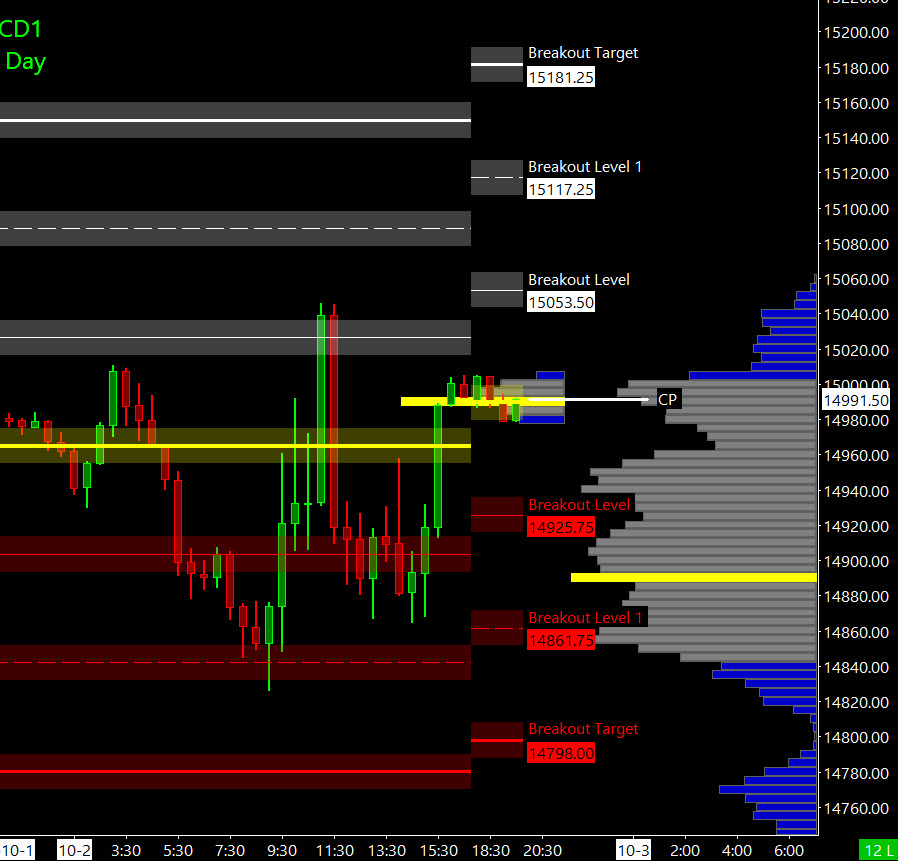
Nasdaq 100 (NQ)

Prior Session was Cycle Day 3 (CD3): Positive Three-Day Cycle as price oscillated between 14860 – 14980 in a “balancing act” within multi-day value zone to begin the Fourth-Quarter. Prior range was 220 handles on 757k contracts exchanged.
…Transition from Cycle Day 3 to Cycle Day 1
This leads us into Cycle Day 1 (CD1): Average Decline measures 14798. Price continues to form a multi-day balancing value zone between 14860 – 14980. Not much has changed as trading transitions to the fourth-quarter, so we’ll continue to stay flexible and find short-term opportunities within value zone until the next directional breakout. As such, scenarios to consider for today’s trading.
Bull Scenario: Price sustains a bid above 14950, initially targets 15050 – 15090 zone.
Bear Scenario: Price sustains an offer below 14950, initially targets 14860 – 14840 zone.
PVA High Edge = 14970 PVA Low Edge = 14885 Prior POC = 14915
Range Projections and Key Levels (NQ) December 2023 (Z) Contract
HOD ATR Range Projection: 15218; LOD ATR Range Projection: 14760; 3 Day Central Pivot: 14901; 3 Day Cycle Target: 15270; 10 Day Average True Range: 245; VIX: 17
Trade Strategy: Our tactical trade strategy will simply remain unaltered…We’ll be flexible to trade both long and short side from Decision Pivot Levels. Continue to focus on Bull/Bear Stackers and Premium/Discounts. As always, remaining in alignment with dominant intra-day force increases probabilities of producing winning trades.
Stay Focused…Non-Biased…Disciplined ALWAYS USE STOPS!
Good Trading…David
“Knowing is not enough, We must APPLY. Willing is not enough, We must DO.” –Bruce Lee
*****This trade strategy report is disseminated for “education only” and should not be viewed in any way as a recommendation to buy or sell futures products.”
PAST PERFORMANCE IS NOT NECESSARILY INDICATIVE OF FUTURE RESULTS
IMPORTANT NOTICE! No representation is being made that the use of this strategy or any system or trading methodology will generate profits. Past performance is not necessarily indicative of future results. There is substantial risk of loss associated with trading securities and options on equities. Only risk capital should be used to trade. Trading securities is not suitable for everyone.
Disclaimer: Futures, Options, and Currency trading all have large potential rewards, but they also have large potential risk. You must be aware of the risks and be willing to accept them in order to invest in these markets. Don’t trade with money you can’t afford to lose.
This website is neither a solicitation nor an offer to Buy/Sell futures, options, or currencies. No representation is being made that any account will or is likely to achieve profits or losses similar to those discussed on this web site. The past performance of any trading system or methodology is not necessarily indicative of future results.
CFTC RULE 4.41 –HYPOTHETICAL OR SIMULATED PERFORMANCE RESULTS HAVE CERTAIN LIMITATIONS. UNLIKE AN ACTUAL PERFORMANCE RECORD, SIMULATED RESULTS DO NOT REPRESENT ACTUAL TRADING. ALSO, SINCE THE TRADES HAVE NOT BEEN EXECUTED, THE RESULTS MAY HAVE UNDER-OR-OVER COMPENSATED FOR THE IMPACT, IF ANY, OF CERTAIN MARKET FACTORS, SUCH AS LACK OF LIQUIDITY. SIMULATED TRADING PROGRAMS IN GENERAL ARE ALSO SUBJECT TO THE FACT THAT THEY ARE DESIGNED WITH THE BENEFIT OF HINDSIGHT. NO REPRESENTATION IS BEING MADE THAT ANY ACCOUNT WILL OR IS LIKELY TO ACHIEVE PROFIT OR LOSSES SIMILAR TO THOSE SHOWN