
Markets
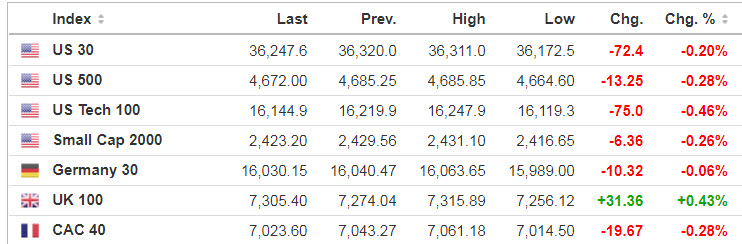
Source: SeekingAlpha.com
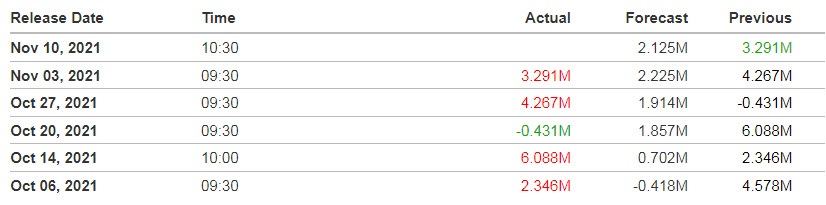
Economic Calendar

Get ready for some early action this morning as the consumer price index for October is published at 8:30 a.m. ET. The figure is expected to come in flaming once again, rising 5.8% Y/Y, though some economists even see a 5.9% advance or above, which would be the biggest Y/Y increase since December 1990. While the Fed has maintained that the pickup in inflation will be transitory (how long is that?), the stance has recently shifted with the central now seeing prices staying elevated into next year
8:30 Initial Jobless Claims
10:00 Wholesale Inventories (Preliminary)
10:00 Atlanta Fed’s Business Inflation Expectations
12:00 PM EIA Natural Gas Inventory
1:00 PM Results of $25B, 30-Year Note Auction
2:00 PM Treasury Statement
https://www.investing.com/economic-calendar/
***New: PTG Trading Room Chat Log’s Link

10:30 EIA Petroleum Inventories
Note: API reported U.S. crude stockpiles unexpectedly fell last week by 2.5 million barrels compared with a build of 3.6 million barrels for the previous week. This decrease is exacerbating expectations that supply will remain tight as demand continued to improve.
S&P 500

***Written 8 pm Tuesday evening for Wednesday’s trading for contribution to MrTopStep’s “The Opening Print” publication.
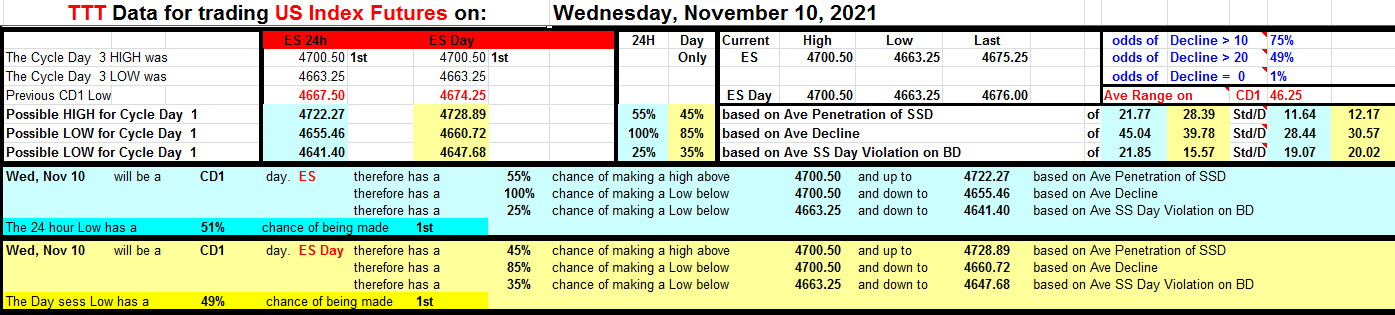
Tuesday’s Session was Cycle Day 3 (CD3): 3-Day Cycle Objective (4702) having been fulfilled and price failing to push above 4700 during Opening Range, setting up this session’s decline. Range was 37 handles on 1.255M contracts exchanged.
…Transition from Cycle Day 3 to Cycle Day 1
This leads us into Cycle Day 1 (CD1): Average Decline projection for CD1 measures 4655.50. Part of this decline is in-place during the previous session, so potential for further weakness spilling over into this session if prior low (4663) is violated and converted into lower resistance. As such, estimated scenarios to consider for today’s trading.
1.) Price sustains a bid above 4665, initially targets 4675 – 4685 zone.
2.) Price sustains an offer below 4665, initially targets 4655 – 4650 zone.
*****The 3 Day Cycle has a 91% probability of fulfilling Positive Cycle Statistics covering 12 years of recorded tracking history.
For more detailed information for both bullish and bearish projected targets, please visit: PTG 3 Day Cycle and/or reference the Cycle Spreadsheet below:
Link to access full Cycle Spreadsheet > > Cycle Day 1 (CD1)
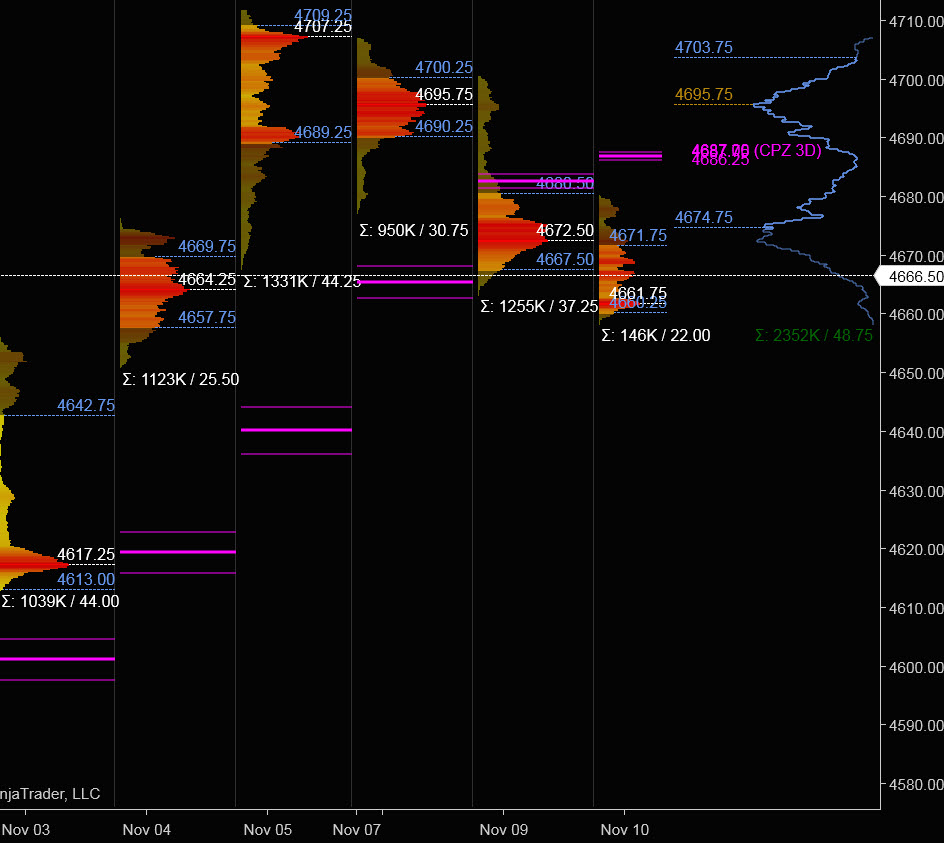
PVA High Edge = 4680 PVA Low Edge = 4667 Prior POC = 4673
Range Projections and Key Levels (ES) December 2021 (Z) Contract
HOD ATR Range Projection: 4694; LOD ATR Range Projection: 4647; 3 Day Central Pivot: 4687; 3 Day Cycle Target: 4693; 10 Day Average True Range 33; VIX: 18
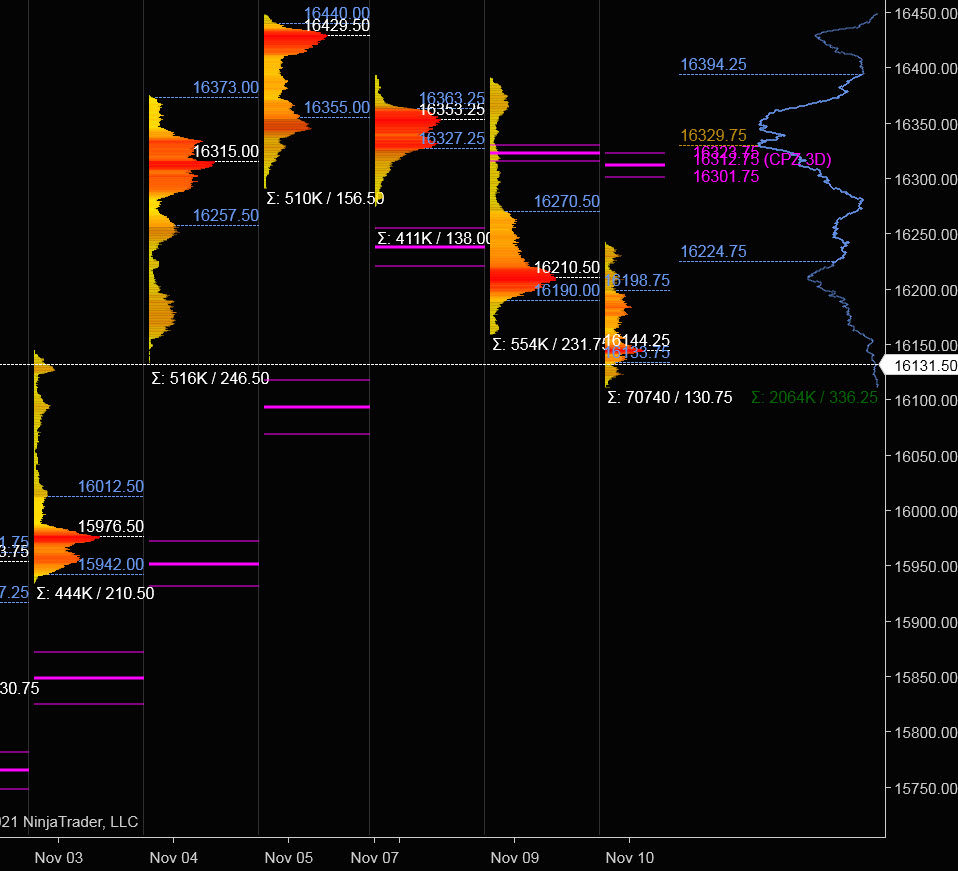
Nasdaq 100 (NQ)

Today is Cycle Day 1 (CD1)…Price is trading below prior low (16160) as selling pressure is spilling over into today ‘s session. Average Decline for CD1 (16203) has been surpassed. Prior range was 232 handles on 554k contracts exchanged. As such, there are two estimated scenarios to consider for today’s trading.
PVA High Edge = 16270 PVA Low Edge = 16190 Prior POC = 16210
Bull Scenario: IF Bulls sustain a bid above 16160, THEN initial upside estimate targets 16190 – 16210 zone.
Bear Scenario: IF Bears sustain an offer below 16160, THEN initial downside estimate targets 16117 – 16069 zone.
Range Projections and Key Levels (NQ) December 2021 (Z) Contract
HOD ATR Range Projection: 16290; LOD ATR Range Projection: 16065; 3 Day Central Pivot: 16313; 3 Day Cycle Target: 16378; 10 Day Average True Range: 177; VIX: 18
Trade Strategy: Our tactical trade strategy will simply remain unaltered…We’ll be flexible to trade both long and short side from Decision Pivot Levels. Continue to focus on Bull/Bear Stackers and Premium/Discounts. As always, remaining in alignment with dominant intra-day force increases probabilities of producing winning trades.
Stay Focused…Non-Biased…Disciplined ALWAYS USE STOPS!
Good Trading…David
“Knowing is not enough, We must APPLY. Willing is not enough, We must DO.” –Bruce Lee
*****This trade strategy report is disseminated for “education only” and should not be viewed in any way as a recommendation to buy or sell futures products.”
PAST PERFORMANCE IS NOT NECESSARILY INDICATIVE OF FUTURE RESULTS
IMPORTANT NOTICE! No representation is being made that the use of this strategy or any system or trading methodology will generate profits. Past performance is not necessarily indicative of future results. There is substantial risk of loss associated with trading securities and options on equities. Only risk capital should be used to trade. Trading securities is not suitable for everyone.
Disclaimer: Futures, Options, and Currency trading all have large potential rewards, but they also have large potential risk. You must be aware of the risks and be willing to accept them in order to invest in these markets. Don’t trade with money you can’t afford to lose.
This website is neither a solicitation nor an offer to Buy/Sell futures, options, or currencies. No representation is being made that any account will or is likely to achieve profits or losses similar to those discussed on this web site. The past performance of any trading system or methodology is not necessarily indicative of future results.
CFTC RULE 4.41 –HYPOTHETICAL OR SIMULATED PERFORMANCE RESULTS HAVE CERTAIN LIMITATIONS. UNLIKE AN ACTUAL PERFORMANCE RECORD, SIMULATED RESULTS DO NOT REPRESENT ACTUAL TRADING. ALSO, SINCE THE TRADES HAVE NOT BEEN EXECUTED, THE RESULTS MAY HAVE UNDER-OR-OVER COMPENSATED FOR THE IMPACT, IF ANY, OF CERTAIN MARKET FACTORS, SUCH AS LACK OF LIQUIDITY. SIMULATED TRADING PROGRAMS IN GENERAL ARE ALSO SUBJECT TO THE FACT THAT THEY ARE DESIGNED WITH THE BENEFIT OF HINDSIGHT. NO REPRESENTATION IS BEING MADE THAT ANY ACCOUNT WILL OR IS LIKELY TO ACHIEVE PROFIT OR LOSSES SIMILAR TO THOSE SHOWN