
Markets

Economic Calendar
8:30 Chicago Fed National Activity Index
11:30 Results of $42B, 2-Year Note Auction
1:00 PM Results of $43B, 5-Year Note Auction
***New: PTG Average Daily Range Calculator
S&P 500

Prior Session was Cycle Day 2 (CD2): Another roller coaster ride as price rallied in the AM Session, only to reverse direction in the PM Session, yet again to rally into the closing weekly bell. I refer to this day type as “Range-Runner.” Options Expiry was indeed an influence on trade activity. Range was 51 handles on 1.470M contracts exchanged.
…Transition from Cycle Day 2 to Cycle Day 3
This leads us into Cycle Day 3 (CD3): Cycle Targets have been fulfilled, so today we’ll mark as a “wild-card.” Control appears to be evenly matched between Bulls and Bears as price continues to oscillate in a wide range between 3900 – 4000. As such, estimated scenarios to consider for today’s trading.
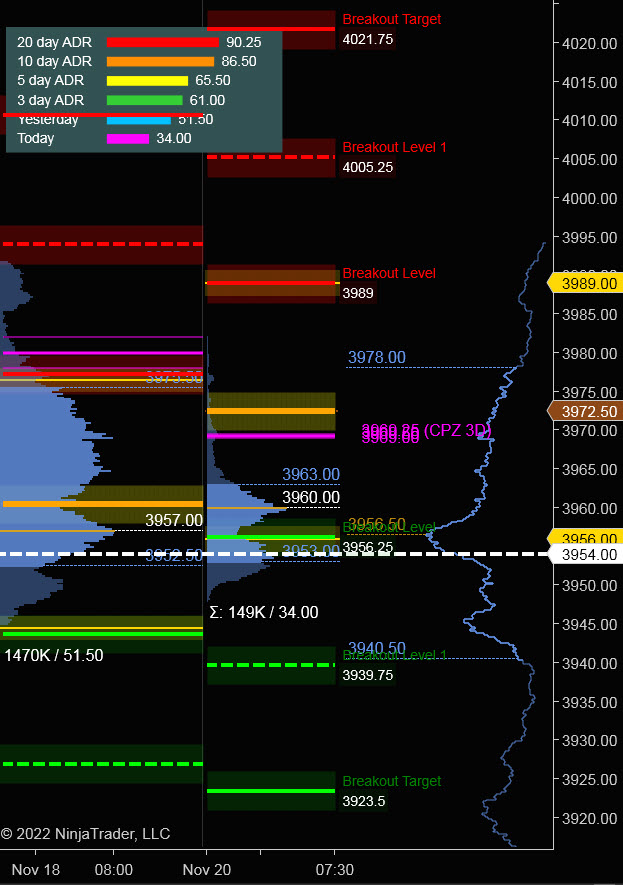
Bull Scenario: Price sustains bid above 3955, initially targets 3970 – 3975 zone.
Bear Scenario: Price sustains offer below 3955, initially targets 3940 – 3935 zone.
PVA High Edge = 3975 PVA Low Edge = 3952 Prior POC = 3957
Range Projections and Key Levels (ES) December 2022 (Z) Contract
HOD ATR Range Projection: 4035; LOD ATR Range Projection: 3896; 3 Day Central Pivot: 3970; 3 Day Cycle Target: 3952; 10 Day Average True Range 86; VIX: 24
Nasdaq 100 (NQ)

Today is Cycle Day 3 (CD3)…Cycle Targets have been fulfilled, so today we’ll mark as a “wild-card.” Control appears to be evenly matched between Bulls and Bears as price continues to oscillate in a wide range between 11500 – 12100. As such, estimated scenarios to consider for today’s trading.
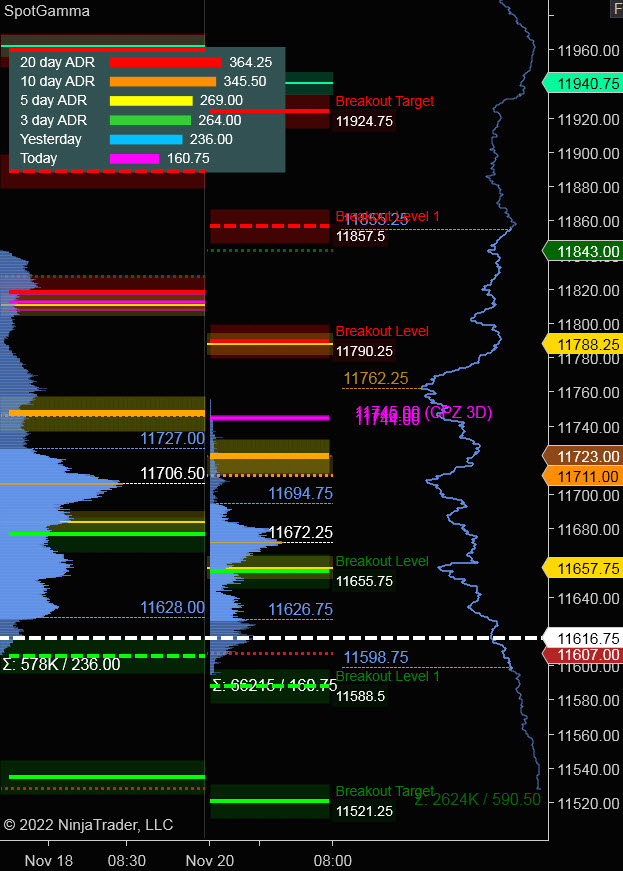
Bull Scenario: IF Bulls sustains bid above 11670, THEN initial upside estimate targets 11730 – 11740 zone.
Bear Scenario: IF Bears sustains offer below 11670, THEN initial downside estimate targets 11580 – 11570 zone.
PVA High Edge = 11727 PVA Low Edge = 11628 Prior POC = 11706
Range Projections and Key Levels (NQ) December 2022 (Z) Contract
HOD ATR Range Projection: 119940; LOD ATR Range Projection: 11410; 3 Day Central Pivot: 11745; 3 Day Cycle Target: 11996; 10 Day Average True Range: 345; VIX: 24
Trade Strategy: Our tactical trade strategy will simply remain unaltered…We’ll be flexible to trade both long and short side from Decision Pivot Levels. Continue to focus on Bull/Bear Stackers and Premium/Discounts. As always, remaining in alignment with dominant intra-day force increases probabilities of producing winning trades.
Stay Focused…Non-Biased…Disciplined ALWAYS USE STOPS!
Good Trading…David
“Knowing is not enough, We must APPLY. Willing is not enough, We must DO.” –Bruce Lee
*****This trade strategy report is disseminated for “education only” and should not be viewed in any way as a recommendation to buy or sell futures products.”
PAST PERFORMANCE IS NOT NECESSARILY INDICATIVE OF FUTURE RESULTS
IMPORTANT NOTICE! No representation is being made that the use of this strategy or any system or trading methodology will generate profits. Past performance is not necessarily indicative of future results. There is substantial risk of loss associated with trading securities and options on equities. Only risk capital should be used to trade. Trading securities is not suitable for everyone.
Disclaimer: Futures, Options, and Currency trading all have large potential rewards, but they also have large potential risk. You must be aware of the risks and be willing to accept them in order to invest in these markets. Don’t trade with money you can’t afford to lose.
This website is neither a solicitation nor an offer to Buy/Sell futures, options, or currencies. No representation is being made that any account will or is likely to achieve profits or losses similar to those discussed on this web site. The past performance of any trading system or methodology is not necessarily indicative of future results.
CFTC RULE 4.41 –HYPOTHETICAL OR SIMULATED PERFORMANCE RESULTS HAVE CERTAIN LIMITATIONS. UNLIKE AN ACTUAL PERFORMANCE RECORD, SIMULATED RESULTS DO NOT REPRESENT ACTUAL TRADING. ALSO, SINCE THE TRADES HAVE NOT BEEN EXECUTED, THE RESULTS MAY HAVE UNDER-OR-OVER COMPENSATED FOR THE IMPACT, IF ANY, OF CERTAIN MARKET FACTORS, SUCH AS LACK OF LIQUIDITY. SIMULATED TRADING PROGRAMS IN GENERAL ARE ALSO SUBJECT TO THE FACT THAT THEY ARE DESIGNED WITH THE BENEFIT OF HINDSIGHT. NO REPRESENTATION IS BEING MADE THAT ANY ACCOUNT WILL OR IS LIKELY TO ACHIEVE PROFIT OR LOSSES SIMILAR TO THOSE SHOWN6.22.22