
Markets
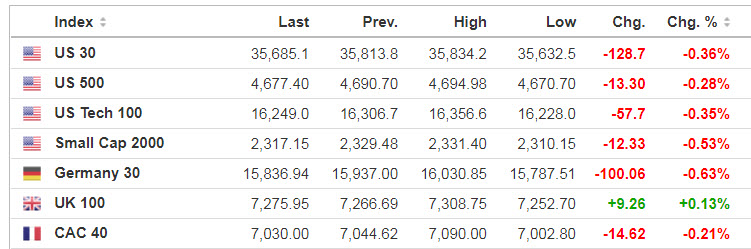
Source: SeekingAlpha.com
Economic Calendar
8:30 GDP Q3
8:30 International Trade in Goods (Advance)
8:30 Initial Jobless Claims
8:30 Corporate profits
8:30 Retail Inventories (Advance)
8:30 Wholesale Inventories (Advance)
10:00 New Home Sales
10:00 Personal Income and Outlays
10:00 Consumer Sentiment
10:00 State Street Investor Confidence Index
11:00 Survey of Business Uncertainty
12:00 PM EIA Natural Gas Inventory
1:00 PM Baker-Hughes Rig Count
2:00 PM FOMC Minutes
https://www.investing.com/economic-calendar/
***New: PTG Trading Room Chat Log’s Link

10:30 EIA Petroleum Inventories
WTI crude rose more than 4% over the last 24 hours to retake $79/bbl after the Biden administration announced plans to release 50M barrels of oil from the U.S. Strategic Reserve, along with China, Japan, India, South Korea and the U.K. While the move was meant to lower prices, the volumes announced were much less than the market was expecting and would need to be sustained over a longer period of time. Many of the barrels will also need to be returned by the refiners who buy them, leaving traders forecasting tighter balances.

S&P 500

***Written 8 pm Tuesday evening for Wednesday’s trading for contribution to MrTopStep’s “The Opening Print” publication.
Tuesday’s Session was Cycle Day 1 (CD1): The decline which began on Cycle Day 3 spilled into this cycle day, exceeding average decline (4668), pushing to lower violation levels (4650). Range was 47 handles on 1.833M contracts exchanged, twice the average volume.
…Transition from Cycle Day 1 to Cycle Day 2
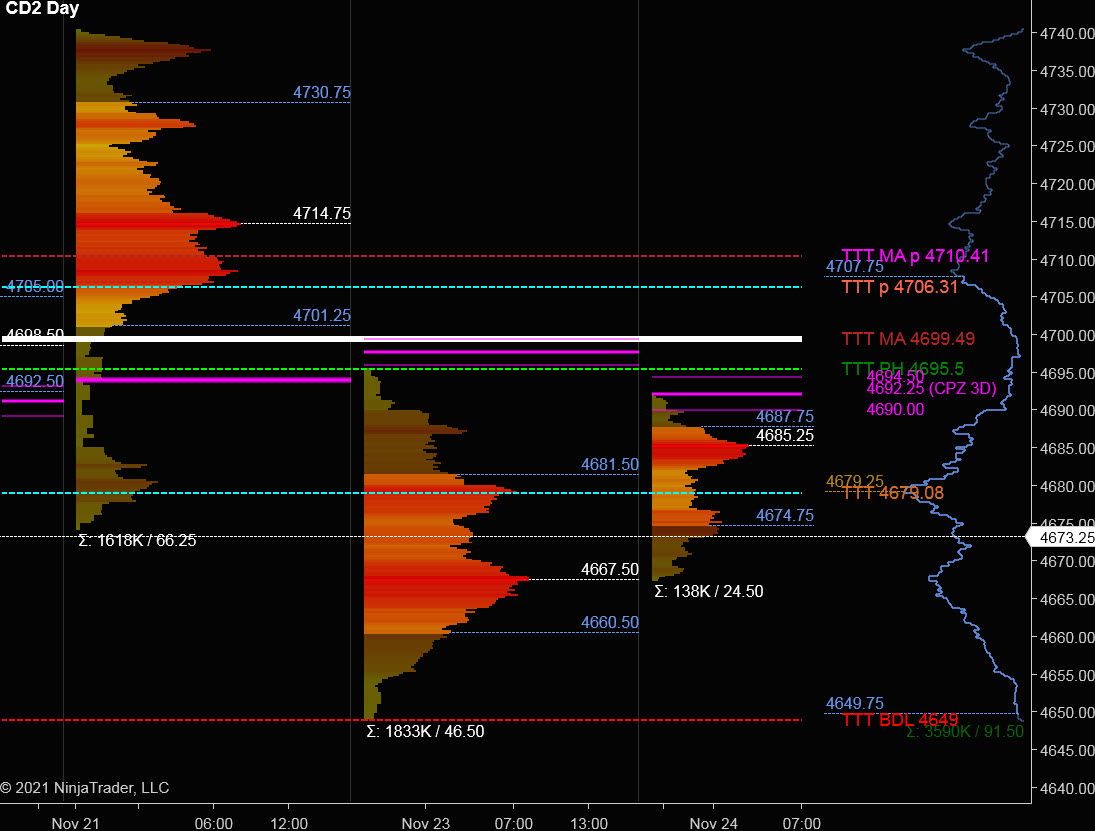
This leads us into Cycle Day 2 (CD2): Bullish Reversal from lower violation level (4650) has rallied price to the initial upside target (4695). Normal for Cycle Day 2 is for stabilization/consolidation of recent activity. Given pre-holiday trade unfolding, anything goes for this session as Friday is a half-day session. As such, estimated scenarios to consider for today’s trading.
1.) Price sustains a bid above 4680, initially targets 4695 – 4700 zone.
2.) Price sustains an offer below 4680, initially targets 4670 – 4665 zone.
*****The 3 Day Cycle has a 91% probability of fulfilling Positive Cycle Statistics covering 12 years of recorded tracking history.
For more detailed information for both bullish and bearish projected targets, please visit: PTG 3 Day Cycle and/or reference the Cycle Spreadsheet below:
Link to access full Cycle Spreadsheet > > Cycle Day 2 (CD2)
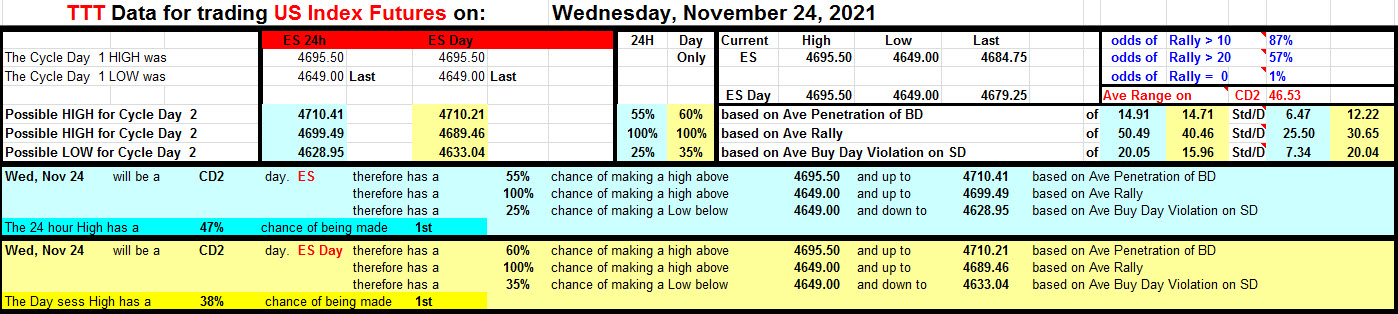
PVA High Edge = 4681 PVA Low Edge = 4660 Prior POC = 4668
Range Projections and Key Levels (ES) December 2021 (Z) Contract
HOD ATR Range Projection: 4728; LOD ATR Range Projection: 4710; 3 Day Central Pivot: 4692; 3 Day Cycle Target: 4700; 10 Day Average True Range 31; VIX: 19.75
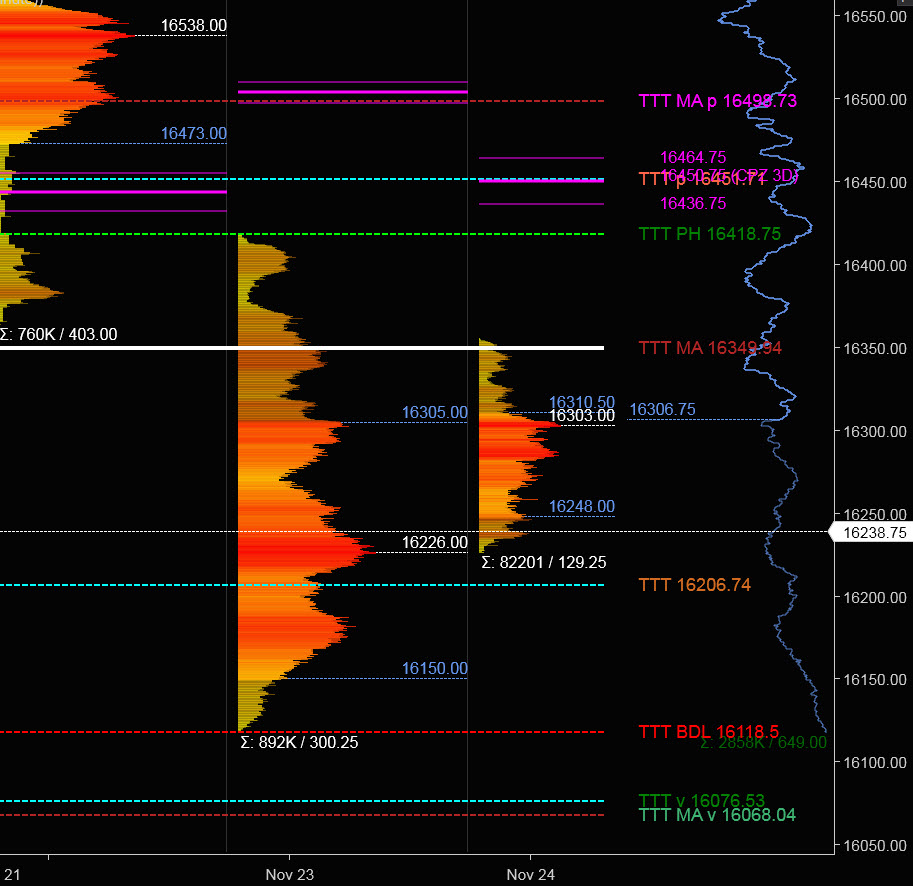
Nasdaq 100 (NQ)

Today is Cycle Day 2 (CD2)…Normal for CD2 is for stabilization/consolidation. Price has rallied off the deep CD1 Low (16118) fulfilling initial upside objective (16350) Prior range was 300 handles on 892k contracts exchanged, twice the average volume. As such, there are two estimated scenarios to consider for today’s trading.
PVA High Edge = 16305 PVA Low Edge = 16150 Prior POC = 16226
Bull Scenario: IF Bulls sustain a bid above 16226, THEN initial upside estimate targets 16305 – 16350 zone.
Bear Scenario: IF Bears sustain an offer below 16226, THEN initial downside estimate targets 16150 – 16120 zone.
Range Projections and Key Levels (NQ) December 2021 (Z) Contract
HOD ATR Range Projection: 16444; LOD ATR Range Projection: 16138; 3 Day Central Pivot: 16450; 3 Day Cycle Target: 16350; 10 Day Average True Range: 1218; VIX: 19.75
Trade Strategy: Our tactical trade strategy will simply remain unaltered…We’ll be flexible to trade both long and short side from Decision Pivot Levels. Continue to focus on Bull/Bear Stackers and Premium/Discounts. As always, remaining in alignment with dominant intra-day force increases probabilities of producing winning trades.
Stay Focused…Non-Biased…Disciplined ALWAYS USE STOPS!
Good Trading…David
“Knowing is not enough, We must APPLY. Willing is not enough, We must DO.” –Bruce Lee
*****This trade strategy report is disseminated for “education only” and should not be viewed in any way as a recommendation to buy or sell futures products.”
PAST PERFORMANCE IS NOT NECESSARILY INDICATIVE OF FUTURE RESULTS
IMPORTANT NOTICE! No representation is being made that the use of this strategy or any system or trading methodology will generate profits. Past performance is not necessarily indicative of future results. There is substantial risk of loss associated with trading securities and options on equities. Only risk capital should be used to trade. Trading securities is not suitable for everyone.
Disclaimer: Futures, Options, and Currency trading all have large potential rewards, but they also have large potential risk. You must be aware of the risks and be willing to accept them in order to invest in these markets. Don’t trade with money you can’t afford to lose.
This website is neither a solicitation nor an offer to Buy/Sell futures, options, or currencies. No representation is being made that any account will or is likely to achieve profits or losses similar to those discussed on this web site. The past performance of any trading system or methodology is not necessarily indicative of future results.
CFTC RULE 4.41 –HYPOTHETICAL OR SIMULATED PERFORMANCE RESULTS HAVE CERTAIN LIMITATIONS. UNLIKE AN ACTUAL PERFORMANCE RECORD, SIMULATED RESULTS DO NOT REPRESENT ACTUAL TRADING. ALSO, SINCE THE TRADES HAVE NOT BEEN EXECUTED, THE RESULTS MAY HAVE UNDER-OR-OVER COMPENSATED FOR THE IMPACT, IF ANY, OF CERTAIN MARKET FACTORS, SUCH AS LACK OF LIQUIDITY. SIMULATED TRADING PROGRAMS IN GENERAL ARE ALSO SUBJECT TO THE FACT THAT THEY ARE DESIGNED WITH THE BENEFIT OF HINDSIGHT. NO REPRESENTATION IS BEING MADE THAT ANY ACCOUNT WILL OR IS LIKELY TO ACHIEVE PROFIT OR LOSSES SIMILAR TO THOSE SHOWN