
Markets (Top Stories)
 Dovish signals from the Federal Reserve are reinforcing what traders have been pricing in since the end of October, when the central bank held rates for the second consecutive meeting and a dot plot – that suggested one more hike – was called into question. Since then, stocks have risen at a rapid clip, with the S&P 500 (SP500) climbing out of correction territory in only 16 trading sessions, marking its fastest comeback since the 1970s. Besides lifting markets and risk assets, the prospect of cheaper money saw the 10-year Treasury yield drop overnight to below 4.30%, after touching 5.00% just prior to the last Fed meeting.
Source: SeekingAlpha.com
Economic Calendar
8:30 Q3 GDP
8:30 International Trade in Goods (Advance)
8:30 Retail Inventories (Advance)
8:30 Wholesale Inventories (Advance)
8:30 Corporate Profits
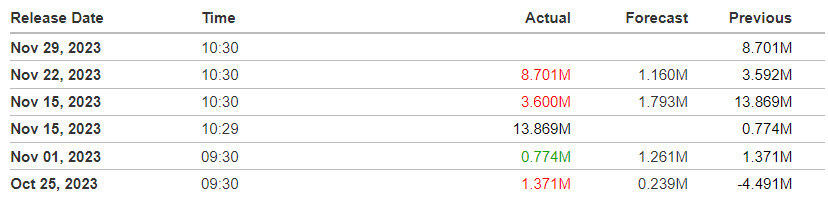
10:30 EIA Petroleum Inventories
11:00 Survey of Business Uncertainty
1:45 PM Fed’s Mester’s Speech
2:00 PM Fed’s Beige Book
https://www.investing.com/economic-calendar/

S&P 500

***Written Tuesday evening for Wednesday’s trading for contribution to MrTopStep’s “The Opening Print” publication.
Prior Session was Cycle Day 2 (CD2): Two-way traffic consolidation continued within prior DTS 11.28.23 outlined parameters of 4555 – 4575 edges. Prior range was 30 handles on 1.382M contracts exchanged.
…Transition from Cycle Day 2 to Cycle Day 3
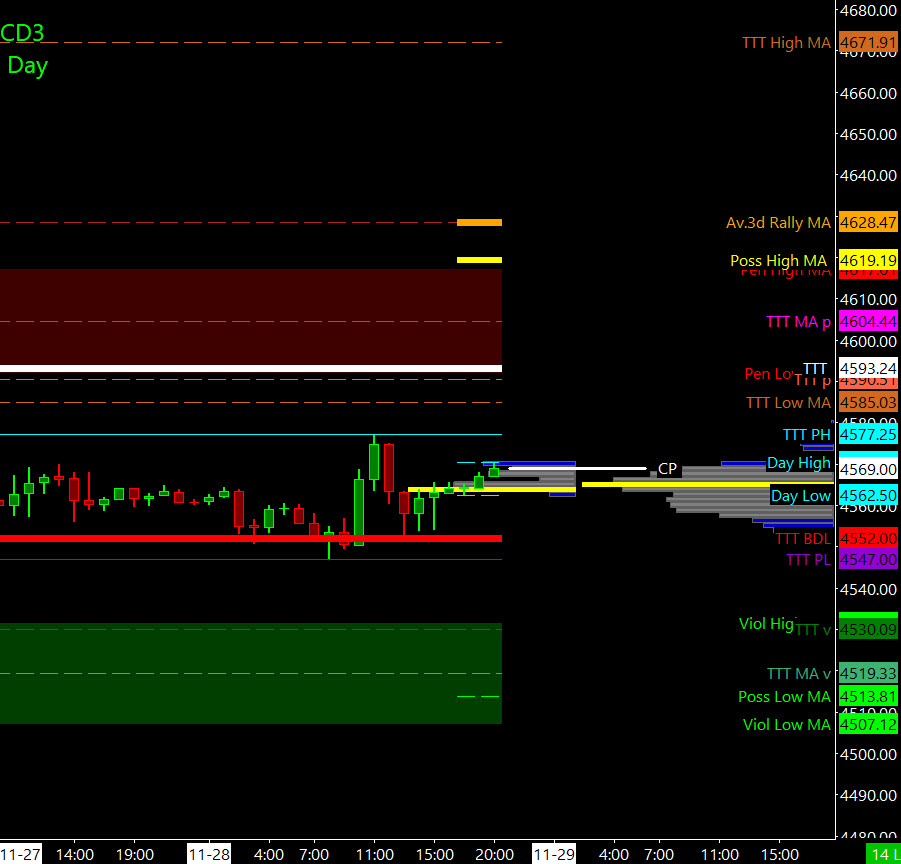
This leads us into Cycle Day 3 (CD3): Three-Day Cycle Statistic will be fulfilled as long as price trades above CD1 Low (4552). This cycle continues to have upside potential targeting 4593 handle. As such, scenarios to consider for today’s trading.
Bull Scenario: Price sustains a bid above 4565, initially targets 4590 – 4595 zone.
Bear Scenario: Price sustains an offer below 4565, initially targets 4540 – 4535 zone.
PVA High Edge = 4565 PVA Low Edge = 4554 Prior POC = 4564
*****The 3 Day Cycle has a 91% probability of fulfilling Positive Cycle Statistics covering 12 years of recorded tracking history.
For more detailed information for both bullish and bearish projected targets, please visit: PTG 3 Day Cycle and/or reference the Cycle Spreadsheet below:
Link to access full Cycle Spreadsheet > > Cycle Day 3 (CD3)
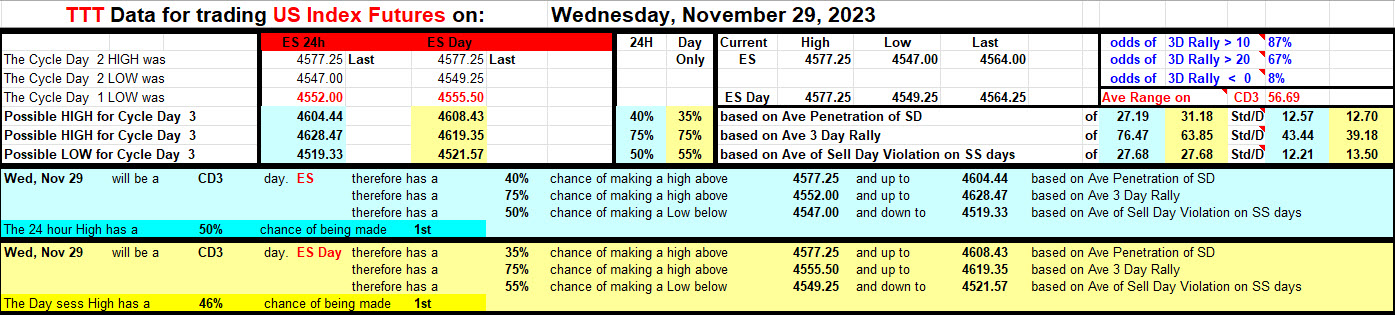
Range Projections and Key Levels (ES) December 2023 (Z) Contract
HOD ATR Range Projection: 4599; LOD ATR Range Projection: 4533; 3 Day Central Pivot: 4565; 3 Day Cycle Target: 4593; 10 Day Average True Range 36; VIX: 12
Nasdaq 100 (NQ)

Prior Session was Cycle Day 2 (CD2): Two-way traffic consolidation continued within prior DTS 11.28.23 outlined parameters of 16050 – 15940 edges. Prior range was 126 handles on 590k contracts exchanged.
…Transition from Cycle Day 2 to Cycle Day 3
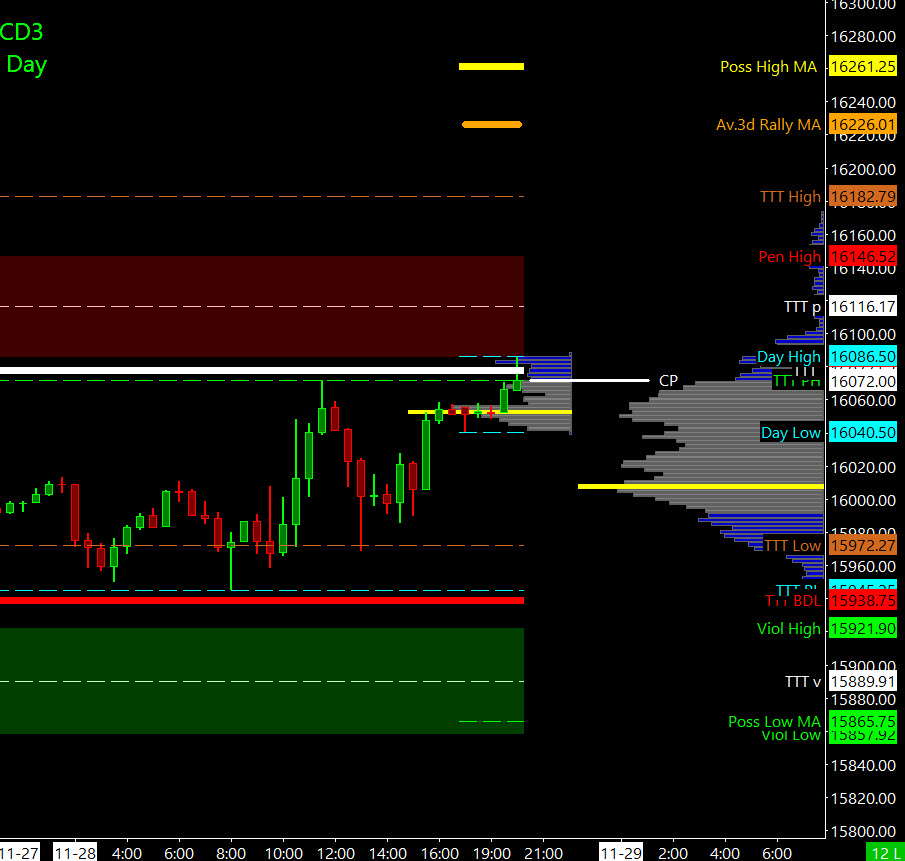
This leads us into Cycle Day 3 (CD3): Three-Day Cycle Statistic will be fulfilled as long as price trades above CD1 Low (15938). This cycle continues to have upside potential targeting 16226 handle. As such, scenarios to consider for today’s trading.
Bull Scenario: Price sustains a bid above 16050, initially targets 16120 – 16155 zone.
Bear Scenario: Price sustains an offer below 16050, initially targets 15980 – 15960 zone.
PVA High Edge = 16022 PVA Low Edge = 15970 Prior POC = 16002
Range Projections and Key Levels (NQ) December 2023 (Z) Contract
HOD ATR Range Projection: 16232; LOD ATR Range Projection: 15895; 3 Day Central Pivot: 16018; 3 Day Cycle Target: 16226; 10 Day Average True Range: 192; VIX: 12
Trade Strategy: Our tactical trade strategy will simply remain unaltered…We’ll be flexible to trade both long and short side from Decision Pivot Levels. Continue to focus on Bull/Bear Stackers and Premium/Discounts. As always, remaining in alignment with dominant intra-day force increases probabilities of producing winning trades.
Stay Focused…Non-Biased…Disciplined ALWAYS USE STOPS!
Good Trading…David
“Knowing is not enough, We must APPLY. Willing is not enough, We must DO.” –Bruce Lee
*****This trade strategy report is disseminated for “education only” and should not be viewed in any way as a recommendation to buy or sell futures products.”
PAST PERFORMANCE IS NOT NECESSARILY INDICATIVE OF FUTURE RESULTS
IMPORTANT NOTICE! No representation is being made that the use of this strategy or any system or trading methodology will generate profits. Past performance is not necessarily indicative of future results. There is substantial risk of loss associated with trading securities and options on equities. Only risk capital should be used to trade. Trading securities is not suitable for everyone.
Disclaimer: Futures, Options, and Currency trading all have large potential rewards, but they also have large potential risk. You must be aware of the risks and be willing to accept them in order to invest in these markets. Don’t trade with money you can’t afford to lose.
This website is neither a solicitation nor an offer to Buy/Sell futures, options, or currencies. No representation is being made that any account will or is likely to achieve profits or losses similar to those discussed on this web site. The past performance of any trading system or methodology is not necessarily indicative of future results.
CFTC RULE 4.41 –HYPOTHETICAL OR SIMULATED PERFORMANCE RESULTS HAVE CERTAIN LIMITATIONS. UNLIKE AN ACTUAL PERFORMANCE RECORD, SIMULATED RESULTS DO NOT REPRESENT ACTUAL TRADING. ALSO, SINCE THE TRADES HAVE NOT BEEN EXECUTED, THE RESULTS MAY HAVE UNDER-OR-OVER COMPENSATED FOR THE IMPACT, IF ANY, OF CERTAIN MARKET FACTORS, SUCH AS LACK OF LIQUIDITY. SIMULATED TRADING PROGRAMS IN GENERAL ARE ALSO SUBJECT TO THE FACT THAT THEY ARE DESIGNED WITH THE BENEFIT OF HINDSIGHT. NO REPRESENTATION IS BEING MADE THAT ANY ACCOUNT WILL OR IS LIKELY TO ACHIEVE PROFIT OR LOSSES SIMILAR TO THOSE SHOWN