
Markets (Top Stories)

Source: SeekingAlpha.com
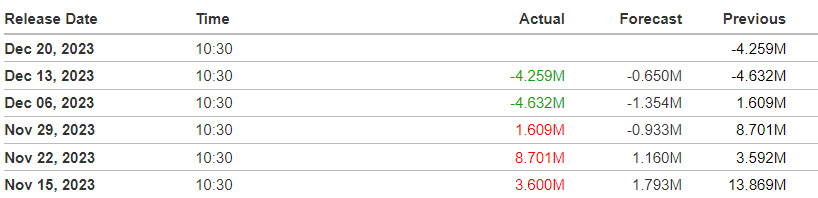
Economic Calendar
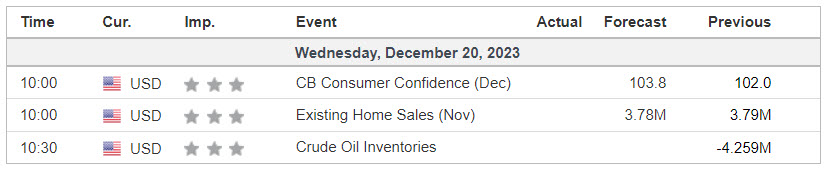
https://www.investing.com/economic-calendar/

S&P 500

***Written Tuesday evening for Wednesday’s trading for contribution to MrTopStep’s “The Opening Print” publication.
Prior Session was Cycle Day 2 (CD2): Normal CD2 as price consolidated in DTS’s upper target zone between 4815 – 4825 as outlined in prior DTS 12.19.23. Prior range was 33 handles on 1.062M contracts exchanged.
…Transition from Cycle Day 2 to Cycle Day 3
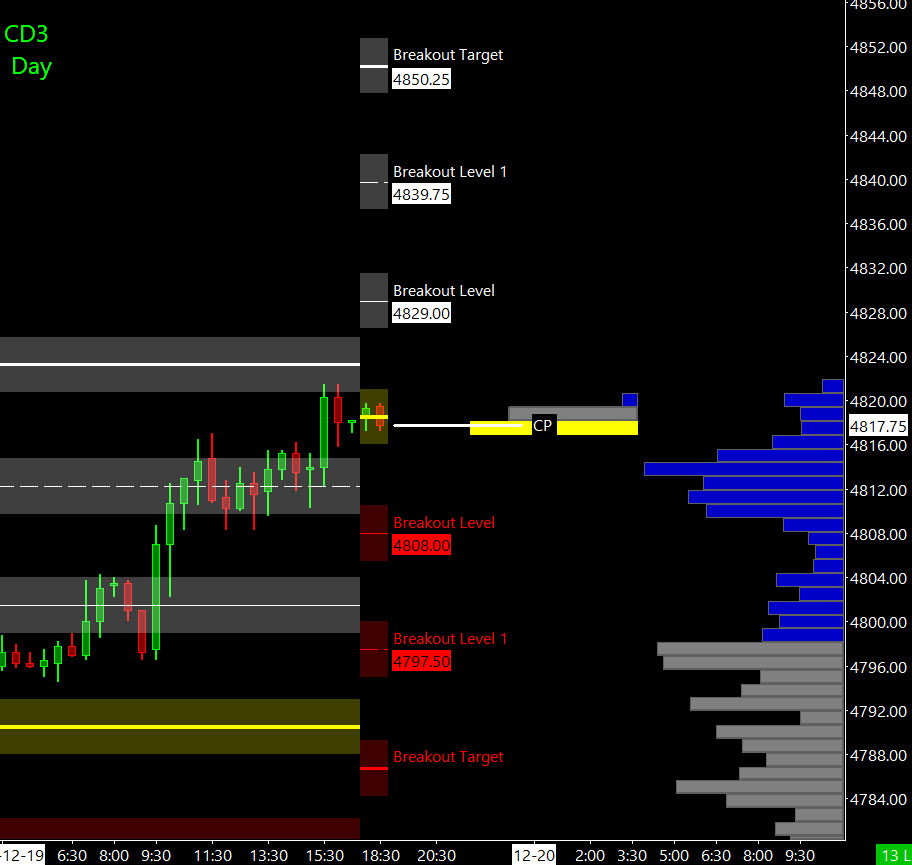
This leads us into Cycle Day 3 (CD3): There still remains additional upside potential to achieve 3 Day Cycle Target (4848), although the next pullback/decline can begin at any time since cycle statistic has been satisfied. As such, scenarios to consider for today’s trading.
Bull Scenario: Price sustains a bid above 4815, initially targets 4825 – 4830 zone.
Bear Scenario: Price sustains an offer below 4815, initially targets 4805 – 4800 zone.
PVA High Edge = 4819 PVA Low Edge = 4806 Prior POC = 4815
*****The 3 Day Cycle has a 91% probability of fulfilling Positive Cycle Statistics covering 12 years of recorded tracking history.
For more detailed information for both bullish and bearish projected targets, please visit: PTG 3 Day Cycle and/or reference the Cycle Spreadsheet below:
Link to access full Cycle Spreadsheet > > Cycle Day 3 (CD3)
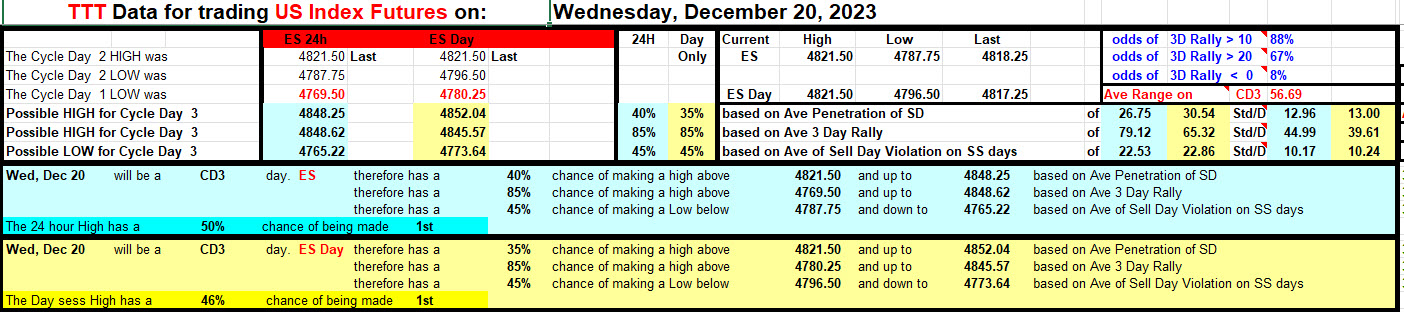
Range Projections and Key Levels (ES) March 2024 (H) Contract
HOD ATR Range Projection: 4860; LOD ATR Range Projection: 4777; 3 Day Central Pivot: 4776; 3 Day Cycle Target: 4848; 10 Day Average True Range 42; VIX: 12
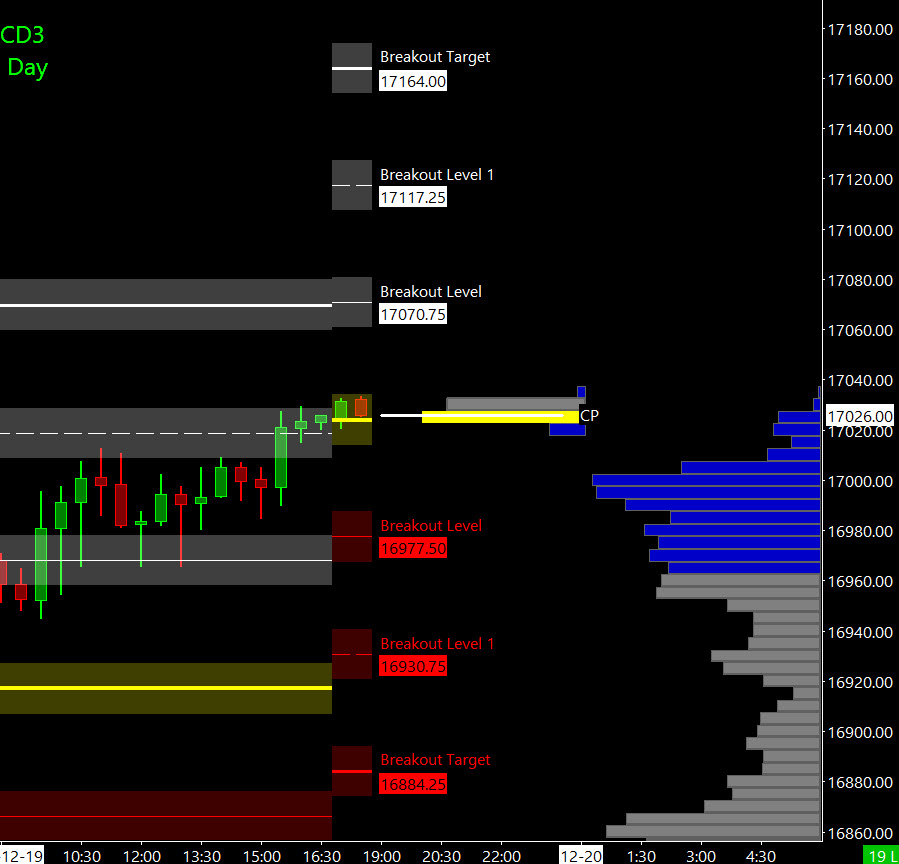
Nasdaq 100 (NQ)

Prior Session was Cycle Day 2 (CD2): Normal CD2 as price consolidated throughout this session. Prior range was 118 handles on 487k contracts exchanged.
…Transition from Cycle Day 2 to Cycle Day 3
This leads us into Cycle Day 3 (CD3): There still remains additional upside potential to achieve 3 Day Cycle Target (17120), although the next pullback/decline can begin at any time since cycle statistic has been satisfied. As such, scenarios to consider for today’s trading.
Bull Scenario: Price sustains a bid above 17015, initially targets 17055 – 17075 zone.
Bear Scenario: Price sustains an offer below 17015, initially targets 16980 – 16965 zone.
PVA High Edge = 17004 PVA Low Edge = 16967 Prior POC = 17000
Range Projections and Key Levels (NQ) March 2024 (H) Contract
HOD ATR Range Projection: 17228; LOD ATR Range Projection: 16824; 3 Day Central Pivot: 16813; 3 Day Cycle Target: 17120; 10 Day Average True Range: 208; VIX: 12
Trade Strategy: Our tactical trade strategy will simply remain unaltered…We’ll be flexible to trade both long and short side from Decision Pivot Levels. Continue to focus on Bull/Bear Stackers and Premium/Discounts. As always, remaining in alignment with dominant intra-day force increases probabilities of producing winning trades.
Stay Focused…Non-Biased…Disciplined ALWAYS USE STOPS!
Good Trading…David
“Knowing is not enough, We must APPLY. Willing is not enough, We must DO.” –Bruce Lee
*****This trade strategy report is disseminated for “education only” and should not be viewed in any way as a recommendation to buy or sell futures products.”
PAST PERFORMANCE IS NOT NECESSARILY INDICATIVE OF FUTURE RESULTS
IMPORTANT NOTICE! No representation is being made that the use of this strategy or any system or trading methodology will generate profits. Past performance is not necessarily indicative of future results. There is substantial risk of loss associated with trading securities and options on equities. Only risk capital should be used to trade. Trading securities is not suitable for everyone.
Disclaimer: Futures, Options, and Currency trading all have large potential rewards, but they also have large potential risk. You must be aware of the risks and be willing to accept them in order to invest in these markets. Don’t trade with money you can’t afford to lose.
This website is neither a solicitation nor an offer to Buy/Sell futures, options, or currencies. No representation is being made that any account will or is likely to achieve profits or losses similar to those discussed on this web site. The past performance of any trading system or methodology is not necessarily indicative of future results.
CFTC RULE 4.41 –HYPOTHETICAL OR SIMULATED PERFORMANCE RESULTS HAVE CERTAIN LIMITATIONS. UNLIKE AN ACTUAL PERFORMANCE RECORD, SIMULATED RESULTS DO NOT REPRESENT ACTUAL TRADING. ALSO, SINCE THE TRADES HAVE NOT BEEN EXECUTED, THE RESULTS MAY HAVE UNDER-OR-OVER COMPENSATED FOR THE IMPACT, IF ANY, OF CERTAIN MARKET FACTORS, SUCH AS LACK OF LIQUIDITY. SIMULATED TRADING PROGRAMS IN GENERAL ARE ALSO SUBJECT TO THE FACT THAT THEY ARE DESIGNED WITH THE BENEFIT OF HINDSIGHT. NO REPRESENTATION IS BEING MADE THAT ANY ACCOUNT WILL OR IS LIKELY TO ACHIEVE PROFIT OR LOSSES SIMILAR TO THOSE SHOWN