
Markets (Top Stories)

Source: SeekingAlpha.com
Economic Calendar
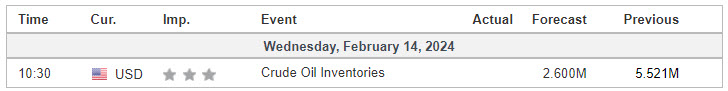
https://www.investing.com/economic-calendar/
S&P 500

***Written for contribution to MrTopStep’s “The Opening Print” publication.
Prior Session was Cycle Day 1 (CD1): Markets declined as expected, though CPI Report was the catalyst for a “long-liquidation”, surpassing all statistically extreme cycle levels. (Note: This will have the effect of recalculating target projections for future cycles) Prior range was 103 handles on 2.003M contracts exchanged.
…Transition from Cycle Day 1 to Cycle Day 2
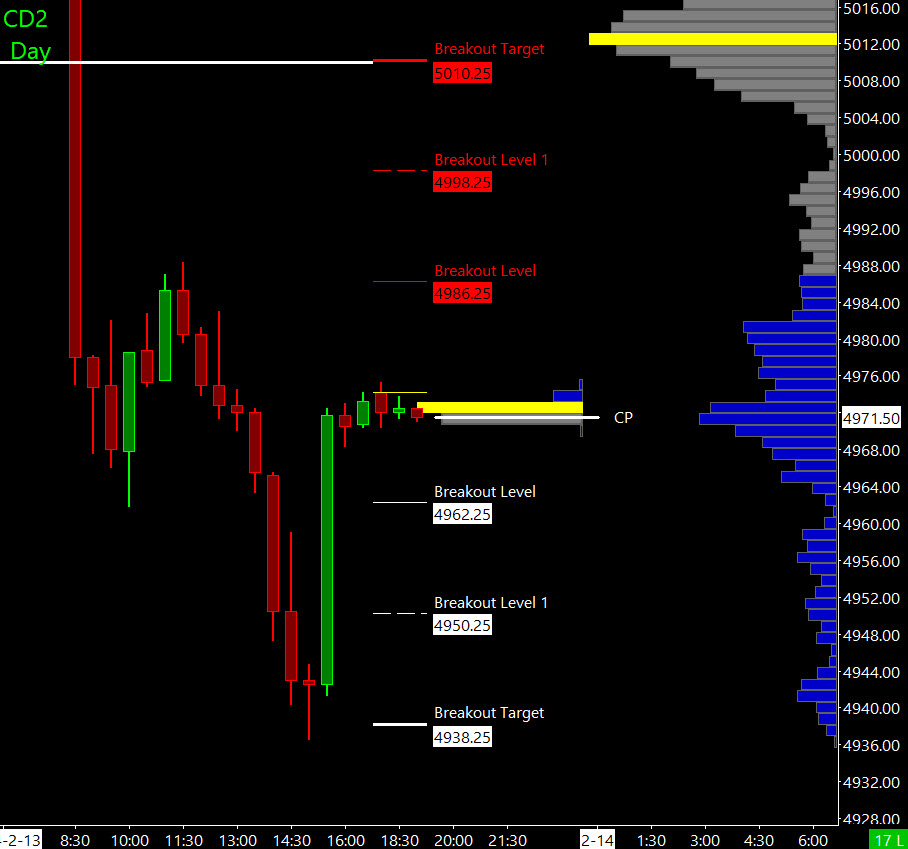
This leads us into Cycle Day 2 (CD2): Late day rally off extreme lows recovered price back to 5-Day POC (4970). Normal for Cycle Day 2 is for consolidation of recent wide-range activity. Market volatility has now increased, with expectations to remain elevated for the immediate term, which should provide ample intra-day trading opportunities. Our daily plan remains unchanged. Stay flexible and in-alignment with the primary intra-day forces. As such, scenarios to consider for today’s trading.
Bull Scenario: Price sustains a bid above 4970, initially targets 4990 – 4995 zone.
Bear Scenario: Price sustains an offer below 4970, initially targets 4960 – 4955 zone.
PVA High Edge = 4990 PVA Low Edge = 4960 Prior POC = 4970
PTG 3 Day Cycle
EXCLUSIVE OFFER

*****The 3 Day Cycle has a 90% probability of fulfilling Positive Cycle Statistics covering 12 years of recorded tracking history.
For more detailed information for both bullish and bearish projected targets, please visit: PTG 3 Day Cycle and/or reference the Cycle Spreadsheet below:
Link to access full Cycle Spreadsheet > > Cycle Day 2 (CD2)
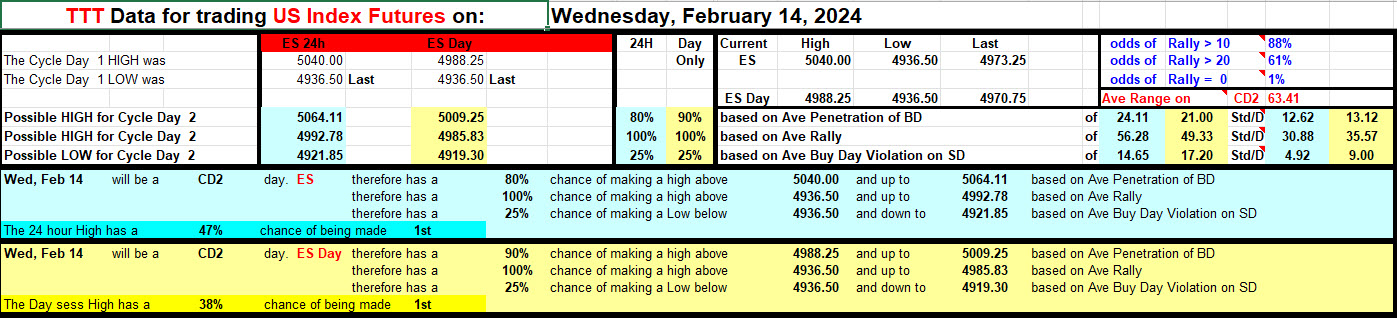
Range Projections (ES) March 2024 (H)
Nasdaq 100 (NQ)

Prior Session was Cycle Day 1 (CD1): Markets declined as expected, though CPI Report was the catalyst for a “long-liquidation”, surpassing all statistically extreme cycle levels. (Note: This will have the effect of recalculating target projections for future cycles) Prior range was 421 handles on 841k contracts exchanged.
…Transition from Cycle Day 1 to Cycle Day 2
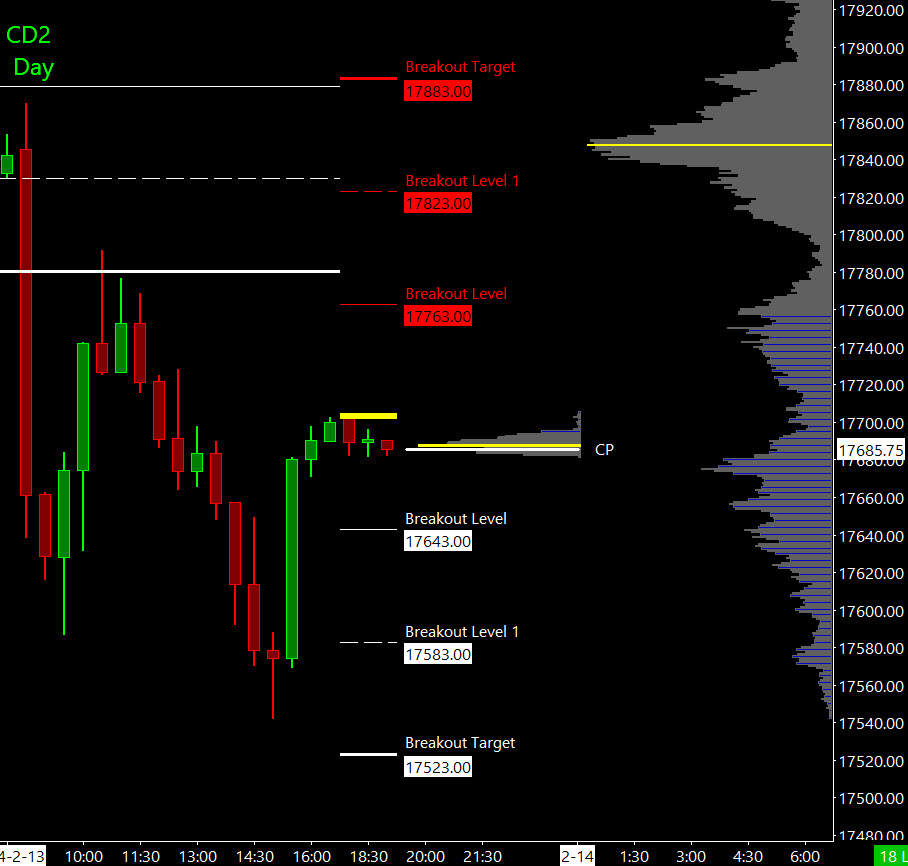
This leads us into Cycle Day 2 (CD2): Late day rally off extreme lows recovered price back to 5-Day POC (17675). Normal for Cycle Day 2 is for consolidation of recent wide-range activity. Market volatility has now increased, with expectations to remain elevated for the immediate term, which should provide ample intra-day trading opportunities. Our daily plan remains unchanged. Stay flexible and in-alignment with the primary intra-day forces. As such, scenarios to consider for today’s trading.
Bull Scenario: Price sustains a bid above 17675, initially targets 17760 – 17790 zone.
Bear Scenario: Price sustains an offer below 17675, initially targets 17610 – 17600 zone.
PVA High Edge = 17747 PVA Low Edge = 17597 Prior POC = 17675
Range Projections (NQ) March 2024 (H)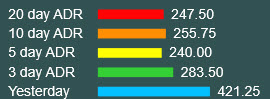
 Oil inventories in huge upside surprise, rising by 8.5M barrels last week : API

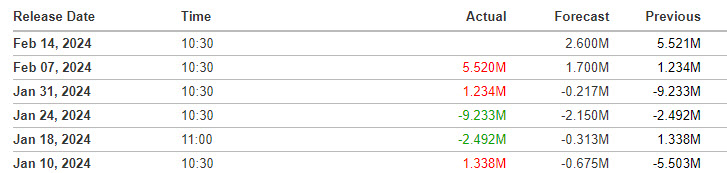
U.S. crude inventories rose by about 8.5 million barrels for the week ended Feb. 9, compared with a build of 674,000 barrels reported by the API for the previous week. Economists were expecting an increase of about 2.6M barrels.
The API data also showed that gasoline inventories fell by about 7.2 million barrels, while distillate stockpiles fell by 4.0M barrels, confounding expectations for a draw of about 1 million barrels and 2.2M barrels, respectively.
The official government inventory report due Wednesday is expected to show weekly U.S. crude supplies decreased by about 2.6M barrels last week.
 Source: investing/com
Trade Strategy: Our tactical trade strategy will simply remain unaltered…We’ll be flexible to trade both long and short side from Decision Pivot Levels. Continue to focus on Bull/Bear Stackers and Premium/Discounts. As always, remaining in alignment with dominant intra-day force increases probabilities of producing winning trades.
Stay Focused…Non-Biased…Disciplined ALWAYS USE STOPS!
Good Trading…David
“Knowing is not enough, We must APPLY. Willing is not enough, We must DO.” –Bruce Lee
*****This trade strategy report is disseminated for “education only” and should not be viewed in any way as a recommendation to buy or sell futures products.”
PAST PERFORMANCE IS NOT NECESSARILY INDICATIVE OF FUTURE RESULTS
IMPORTANT NOTICE! No representation is being made that the use of this strategy or any system or trading methodology will generate profits. Past performance is not necessarily indicative of future results. There is substantial risk of loss associated with trading securities and options on equities. Only risk capital should be used to trade. Trading securities is not suitable for everyone.
Disclaimer: Futures, Options, and Currency trading all have large potential rewards, but they also have large potential risk. You must be aware of the risks and be willing to accept them in order to invest in these markets. Don’t trade with money you can’t afford to lose.
This website is neither a solicitation nor an offer to Buy/Sell futures, options, or currencies. No representation is being made that any account will or is likely to achieve profits or losses similar to those discussed on this web site. The past performance of any trading system or methodology is not necessarily indicative of future results.
CFTC RULE 4.41 –HYPOTHETICAL OR SIMULATED PERFORMANCE RESULTS HAVE CERTAIN LIMITATIONS. UNLIKE AN ACTUAL PERFORMANCE RECORD, SIMULATED RESULTS DO NOT REPRESENT ACTUAL TRADING. ALSO, SINCE THE TRADES HAVE NOT BEEN EXECUTED, THE RESULTS MAY HAVE UNDER-OR-OVER COMPENSATED FOR THE IMPACT, IF ANY, OF CERTAIN MARKET FACTORS, SUCH AS LACK OF LIQUIDITY. SIMULATED TRADING PROGRAMS IN GENERAL ARE ALSO SUBJECT TO THE FACT THAT THEY ARE DESIGNED WITH THE BENEFIT OF HINDSIGHT. NO REPRESENTATION IS BEING MADE THAT ANY ACCOUNT WILL OR IS LIKELY TO ACHIEVE PROFIT OR LOSSES SIMILAR TO THOSE SHOWN