
Markets
Stocks powered higher yesterday despite a PPI that showed U.S. wholesale prices in January soaring 9.7% from a year ago, more than twice analyst estimates and just short of the largest jump on record seen in May 2021. A slew of more important data is on tap for today, like retail sales, industrial production, the housing market index and FOMC minutes, which could shed further light on how price pressures are impacting the economy.

Source: SeekingAlpha.com
Economic Calendar
8:30 Retail Sales
8:30 Import/Export Prices
9:15 Industrial Production
10:00 Business Inventories
10:00 NAHB Housing Market Index
10:00 Atlanta Fed’s Business Inflation Expectations
11:00 Fed’s Kashkari Speech
1:00 PM Results of $19B, 20-Year Bond Auction
2:00 PM FOMC Minutes
https://www.investing.com/economic-calendar/
***New: PTG Trading Room Chat Log’s Link

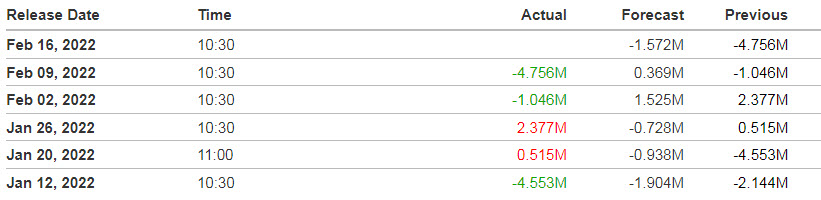
10:30 EIA Petroleum Inventories
Oil prices tumbled more than 3% Tuesday, their most in a day since the year began, as Moscow wound down Russian troops that had ringed Ukraine’s borders for more than two months, removing a huge geopolitical premium from energy markets.
Source: http://Investing.com
S&P 500

***Written Tuesday evening for Wednesday’s trading for contribution to MrTopStep’s “The Opening Print” publication.
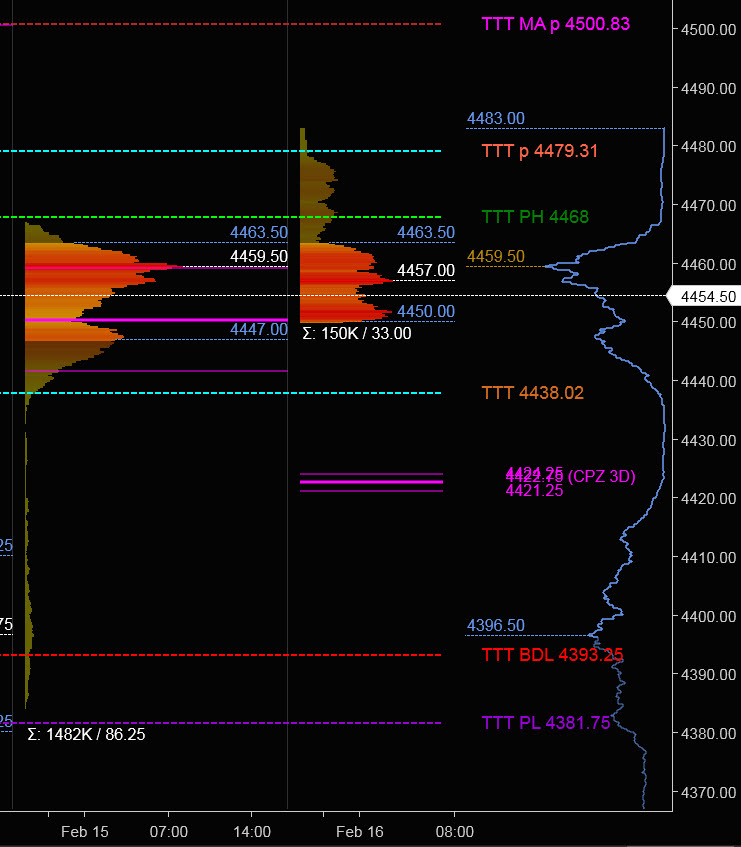
Prior Session was Cycle Day 3 (CD3): ES opening gap held bid throughout this session. oscillating within the confines of the 3 Day Central Pivot Zone (4442 – 4460). 3 Day Cycle Objectives have been fulfilled. Range was 86 handles on 1.481M contracts exchanged.
…Transition from Cycle Day 3 to Cycle Day 1
This leads us into Cycle Day 1 (CD1): Today begins a new cycle, with the Average Decline measuring the 4369 – 4364 zone. Headline risk remains elevated with the geo-political landscape highly agitated, with price swings in both direction occurring at any moment. We expect this action/reaction to continue for the foreseeable future until there is clarity in the Russia/Ukraine situation. As such, estimated scenarios to consider for today’s trading.
1.) Price sustains bid above 4450, initially targets 4475 – 4480 zone.
2.) Price sustains offer below 4450, initially targets 4435 – 4425 zone.
*****The 3 Day Cycle has a 91% probability of fulfilling Positive Cycle Statistics covering 12 years of recorded tracking history.
For more detailed information for both bullish and bearish projected targets, please visit: PTG 3 Day Cycle and/or reference the Cycle Spreadsheet below:
Link to access full Cycle Spreadsheet > > Cycle Day 1 (CD1)
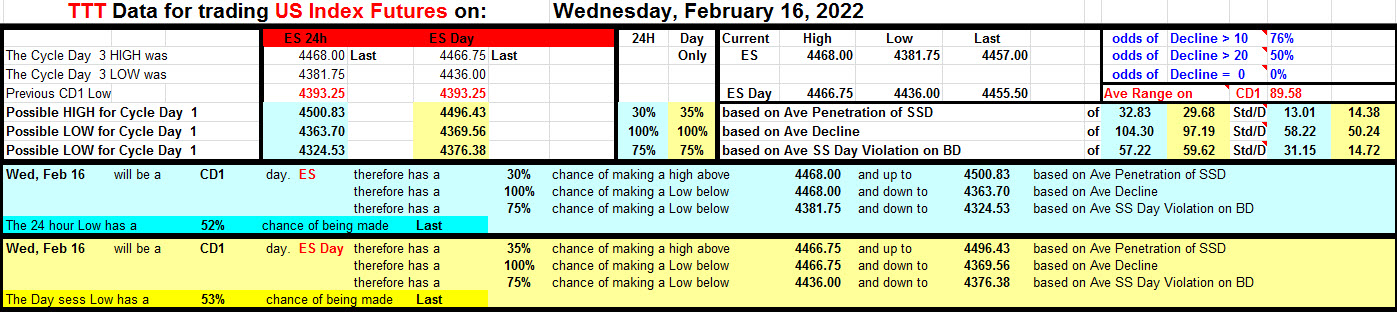
PVA High Edge = 4464 PVA Low Edge = 4447 Prior POC = 4460
Range Projections and Key Levels (ES) March 2022 (H) Contract
HOD ATR Range Projection: 4635; LOD ATR Range Projection: 4398; 3 Day Central Pivot: 4423; 3 Day Cycle Target: 4485; 10 Day Average True Range 185; VIX: 26
Nasdaq 100 (NQ)

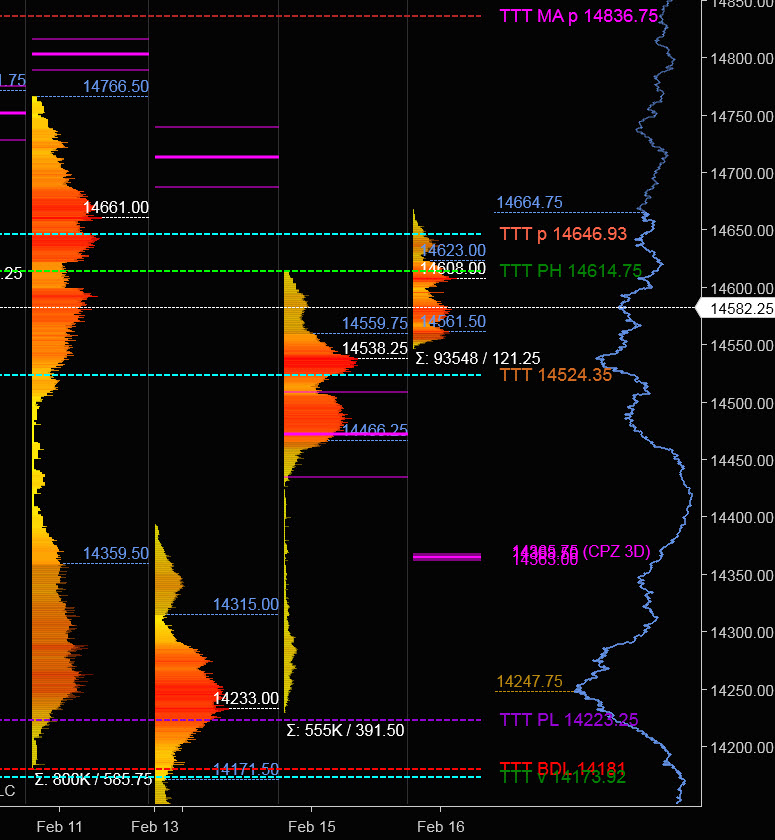
Today is Cycle Day 1 (CD1)…Price is extending this cycle’s rally pushing into CD3 upper Penetration Zone between 14647 – 14669 during overnight trade activity. Average Decline for CD1 measures 14524. Prior range was 392 handles on 555k contracts exchanged. As such, there are two estimated scenarios to consider for today’s trading.
Bull Scenario: IF Bulls sustains bid above 14615, THEN initial upside estimate targets 14647 – 14669 zone.
Bear Scenario: IF Bears sustains offer below 14615, THEN initial downside estimate targets 14548 – 14524 zone.
PVA High Edge = 14560 PVA Low Edge = 14466 Prior POC = 14538
Range Projections and Key Levels (NQ) March 2022 (H) Contract
HOD ATR Range Projection: 14974; LOD ATR Range Projection: 14241; 3 Day Central Pivot: 14365; 3 Day Cycle Target: 14976; 10 Day Average True Range: 427; VIX: 26
Trade Strategy: Our tactical trade strategy will simply remain unaltered…We’ll be flexible to trade both long and short side from Decision Pivot Levels. Continue to focus on Bull/Bear Stackers and Premium/Discounts. As always, remaining in alignment with dominant intra-day force increases probabilities of producing winning trades.
Stay Focused…Non-Biased…Disciplined ALWAYS USE STOPS!
Good Trading…David
“Knowing is not enough, We must APPLY. Willing is not enough, We must DO.” –Bruce Lee
*****This trade strategy report is disseminated for “education only” and should not be viewed in any way as a recommendation to buy or sell futures products.”
PAST PERFORMANCE IS NOT NECESSARILY INDICATIVE OF FUTURE RESULTS
IMPORTANT NOTICE! No representation is being made that the use of this strategy or any system or trading methodology will generate profits. Past performance is not necessarily indicative of future results. There is substantial risk of loss associated with trading securities and options on equities. Only risk capital should be used to trade. Trading securities is not suitable for everyone.
Disclaimer: Futures, Options, and Currency trading all have large potential rewards, but they also have large potential risk. You must be aware of the risks and be willing to accept them in order to invest in these markets. Don’t trade with money you can’t afford to lose.
This website is neither a solicitation nor an offer to Buy/Sell futures, options, or currencies. No representation is being made that any account will or is likely to achieve profits or losses similar to those discussed on this web site. The past performance of any trading system or methodology is not necessarily indicative of future results.
CFTC RULE 4.41 –HYPOTHETICAL OR SIMULATED PERFORMANCE RESULTS HAVE CERTAIN LIMITATIONS. UNLIKE AN ACTUAL PERFORMANCE RECORD, SIMULATED RESULTS DO NOT REPRESENT ACTUAL TRADING. ALSO, SINCE THE TRADES HAVE NOT BEEN EXECUTED, THE RESULTS MAY HAVE UNDER-OR-OVER COMPENSATED FOR THE IMPACT, IF ANY, OF CERTAIN MARKET FACTORS, SUCH AS LACK OF LIQUIDITY. SIMULATED TRADING PROGRAMS IN GENERAL ARE ALSO SUBJECT TO THE FACT THAT THEY ARE DESIGNED WITH THE BENEFIT OF HINDSIGHT. NO REPRESENTATION IS BEING MADE THAT ANY ACCOUNT WILL OR IS LIKELY TO ACHIEVE PROFIT OR LOSSES SIMILAR TO THOSE SHOWN