
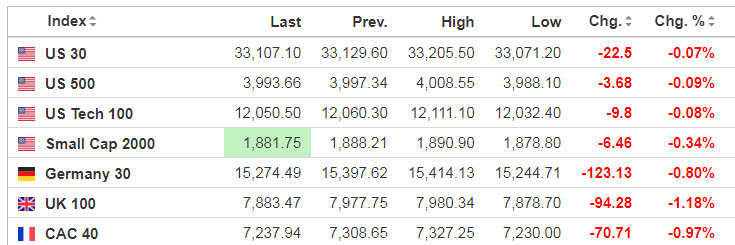
Markets
Stock index futures were little changed overnight after the S&P 500 (SP500) tumbled 2% on Tuesday to mark its largest down day since the December FOMC meeting (and erasing all of its gains for February). “All eyes will be on the release of the Fed’s minutes today.
Source: SeekingAlpha.com
Economic Calendar
10:00 State Street Investor Confidence Index
11:30 Results of $22B, 2-Year FRN Auction
1:00 PM Results of $43B, 5-Year Note Auction
2:00 PM FOMC Minutes
5:30 PM Fed’s Williams Speech
https://www.investing.com/economic-calendar/
S&P 500

***Written Tuesday evening for Wednesday’s trading for contribution to MrTopStep’s “The Opening Print” publication.
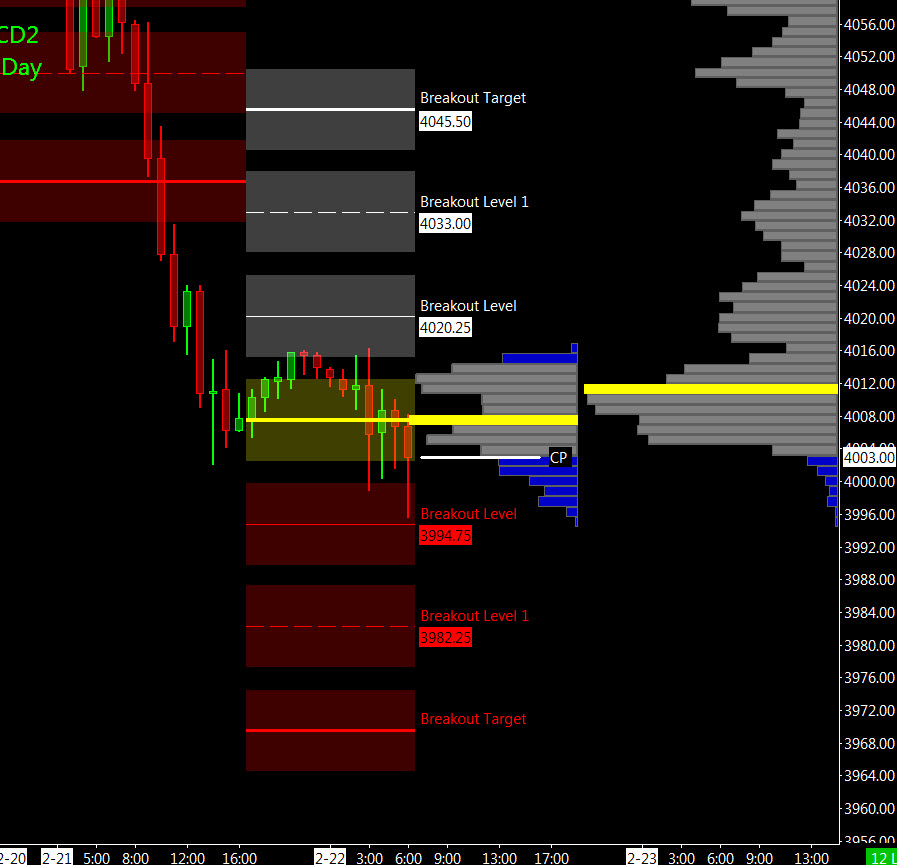
Prior Session was Cycle Day 1 (CD1): Normal for CD1 as price declined and exceeded the 4033 projected target, plunging down to 4003.50 Statistical Range Extreme (screenshot). Prior range was 75 handles on 1.705M contracts exchanged.
…Transition from Cycle Day 1 to Cycle Day 2
This leads us into Cycle Day 2 (CD2): Normal for CD2 is back n fill consolidation to work off recent selling activity. Price has declined to yet another KEY STRIKE (4000) and is absolutely critical that this level holds for bulls. Today the FOMC minutes are released @ 2 pm, which should shed additional light on sustainability of rate hikes. As such, estimated scenarios to consider for today’s trading.
Bull Scenario: Price sustains a bid above 4015, initially targets 4020 – 4025 zone.
Bear Scenario: Price sustains an offer below 4015, initially targets 4095 – 4090 zone.
PVA High Edge = 4038 PVA Low Edge = 4003 Prior POC = 4009
*****The 3 Day Cycle has a 91% probability of fulfilling Positive Cycle Statistics covering 12 years of recorded tracking history.
For more detailed information for both bullish and bearish projected targets, please visit: PTG 3 Day Cycle and/or reference the Cycle Spreadsheet below:
Link to access full Cycle Spreadsheet > > Cycle Day 2 (CD2)
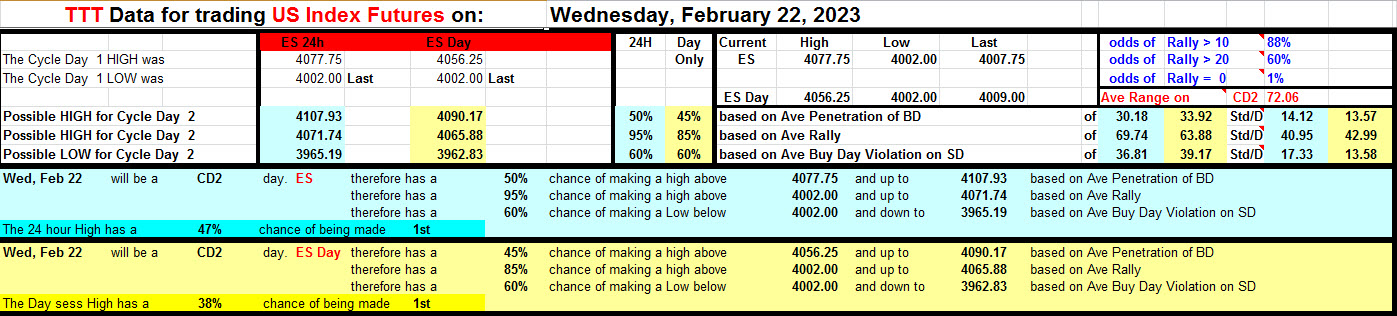
Range Projections and Key Levels (ES) March 2023 (H) Contract
HOD ATR Range Projection: 4064; LOD ATR Range Projection: 3947; 3 Day Central Pivot: 4063; 3 Day Cycle Target: 4067; 10 Day Average True Range 68; VIX: 23
Nasdaq 100 (NQ)

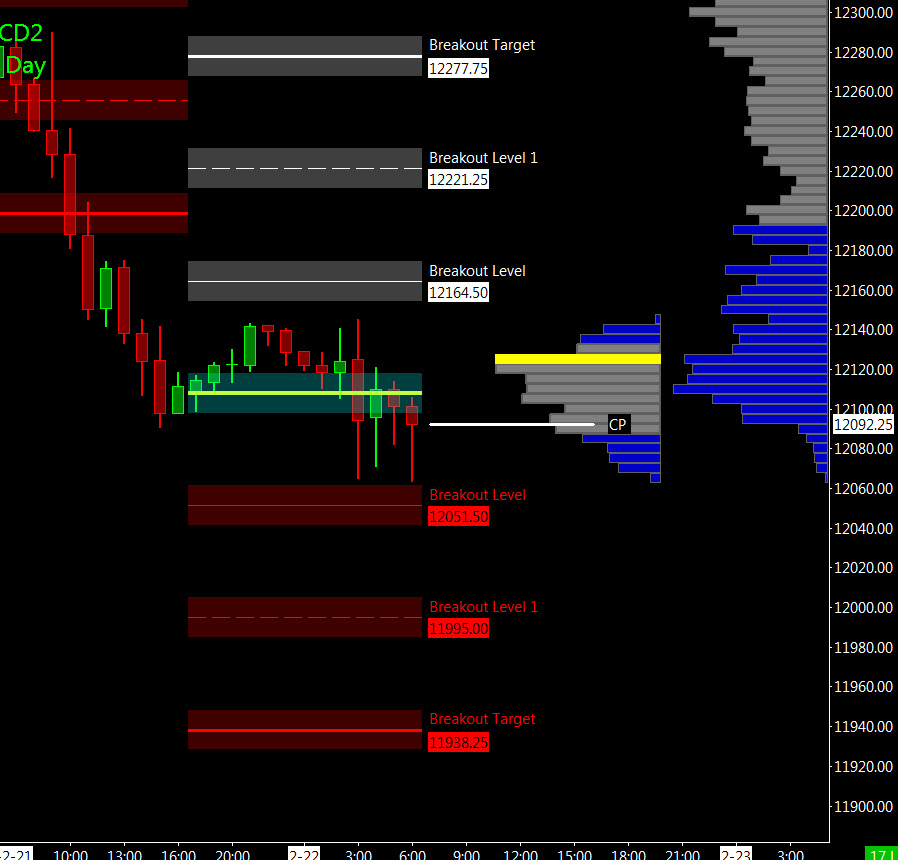
Prior Session was Cycle Day 1 (CD1): Normal for CD1 as price declined and established a new cycle low at 12091. Prior range was 289 handles on 532k contracts exchanged.
…Transition from Cycle Day 1 to Cycle Day 2
Today is Cycle Day 2 (CD2)…Normal for CD2 is back n fill consolidation to work off recent selling activity. Today the FOMC minutes is released @ 2 pm, which should shed additional light on sustainability of rate hikes. As such, estimated scenarios to consider for today’s trading.
Bull Scenario: IF Bulls sustains bid above 12110, THEN initial upside estimate targets 12145– 12150 zone.
Bear Scenario: IF Bears sustains offer below 12110, THEN initial downside estimate targets 12060 – 12050 zone.
PVA High Edge = 12235 PVA Low Edge = 12090 Prior POC = 12110
Range Projections and Key Levels (NQ) March 2022 (H) Contract
HOD ATR Range Projection: 12355; LOD ATR Range Projection: 11853; 3 Day Central Pivot: 12314; 3 Day Cycle Target: 12355; 10 Day Average True Range: 292; VIX: 23
Trade Strategy: Our tactical trade strategy will simply remain unaltered…We’ll be flexible to trade both long and short side from Decision Pivot Levels. Continue to focus on Bull/Bear Stackers and Premium/Discounts. As always, remaining in alignment with dominant intra-day force increases probabilities of producing winning trades.
Stay Focused…Non-Biased…Disciplined ALWAYS USE STOPS!
Good Trading…David
“Knowing is not enough, We must APPLY. Willing is not enough, We must DO.” –Bruce Lee
*****This trade strategy report is disseminated for “education only” and should not be viewed in any way as a recommendation to buy or sell futures products.”
PAST PERFORMANCE IS NOT NECESSARILY INDICATIVE OF FUTURE RESULTS
IMPORTANT NOTICE! No representation is being made that the use of this strategy or any system or trading methodology will generate profits. Past performance is not necessarily indicative of future results. There is substantial risk of loss associated with trading securities and options on equities. Only risk capital should be used to trade. Trading securities is not suitable for everyone.
Disclaimer: Futures, Options, and Currency trading all have large potential rewards, but they also have large potential risk. You must be aware of the risks and be willing to accept them in order to invest in these markets. Don’t trade with money you can’t afford to lose.
This website is neither a solicitation nor an offer to Buy/Sell futures, options, or currencies. No representation is being made that any account will or is likely to achieve profits or losses similar to those discussed on this web site. The past performance of any trading system or methodology is not necessarily indicative of future results.
CFTC RULE 4.41 –HYPOTHETICAL OR SIMULATED PERFORMANCE RESULTS HAVE CERTAIN LIMITATIONS. UNLIKE AN ACTUAL PERFORMANCE RECORD, SIMULATED RESULTS DO NOT REPRESENT ACTUAL TRADING. ALSO, SINCE THE TRADES HAVE NOT BEEN EXECUTED, THE RESULTS MAY HAVE UNDER-OR-OVER COMPENSATED FOR THE IMPACT, IF ANY, OF CERTAIN MARKET FACTORS, SUCH AS LACK OF LIQUIDITY. SIMULATED TRADING PROGRAMS IN GENERAL ARE ALSO SUBJECT TO THE FACT THAT THEY ARE DESIGNED WITH THE BENEFIT OF HINDSIGHT. NO REPRESENTATION IS BEING MADE THAT ANY ACCOUNT WILL OR IS LIKELY TO ACHIEVE PROFIT OR LOSSES SIMILAR TO THOSE SHOWN