
Markets
Stock markets obeying the yield sign
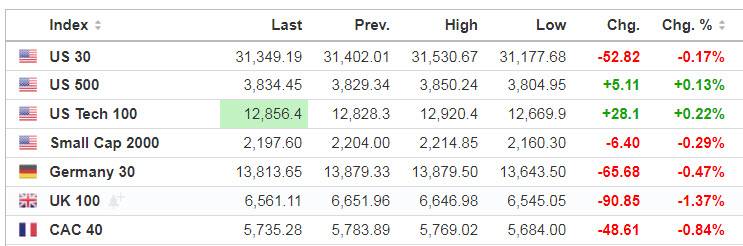
Wall Street looks to get its sea legs back at the open today after being whipsawed by interest rates. U.S. stock index futures are mixed, while Treasury yields are easing early following a spike yesterday that unnerved equity investors. S&P futures +0.2% are slightly higher and Nasdaq 100 futures +0.1% are slightly higher.
Source: SeekingAlpha.com
Economic Calendar
8:30 Retail Inventories (Advance)
8:30 Wholesale Inventories (Advance)
8:30 Personal Income and Outlays
9:45 Chicago PMI
10:00 Consumer Sentiment
1:00 PM Baker-Hughes Rig Count
3:00 PM Farm Prices
https://www.investing.com/economic-calendar/
***New: PTG Trading Room Chat Log’s Link
S&P 500

Prior Session was Cycle Day 3 (CD3): Price failed to push higher, continuing its down slide. Recent bearish shift under the 3 Day Central Pivot Zone marked the beginning of this current decline. Range was 124.25 handles on 2.812M contracts exchanged.
…Transition from Cycle Day 3 to Cycle Day 1
This leads us into Cycle Day 1 (CD1): Momentum has carried price well pass the average statistical decline for CD1 during prior session. Bulls will seek to stabilize the action otherwise risk further decline on last day of February. As such, there are two estimated scenarios to consider for today’s trading.
1.) Price sustains a bid above 3830, initially targets 3850 – 3865 zone.
2.) Price sustains an offer below 3830, initially targets 3810 – 3800 zone.
*****3 Day Cycle has a 91% probability of fulfilling Positive Statistic covering 12 years of recorded tracking history.
PVA High Edge = 3890 PVA Low Edge = 3817 Prior POC = 3830
Range Projections and Key Levels (ES) March 2021 (H) Contract
HOD ATR Range Projection: 3850; LOD ATR Range Projection: 3798; 3 Day Central Pivot: 3870; 10 Day Average True Range 50; VIX: 28

Nasdaq 100 (NQ)

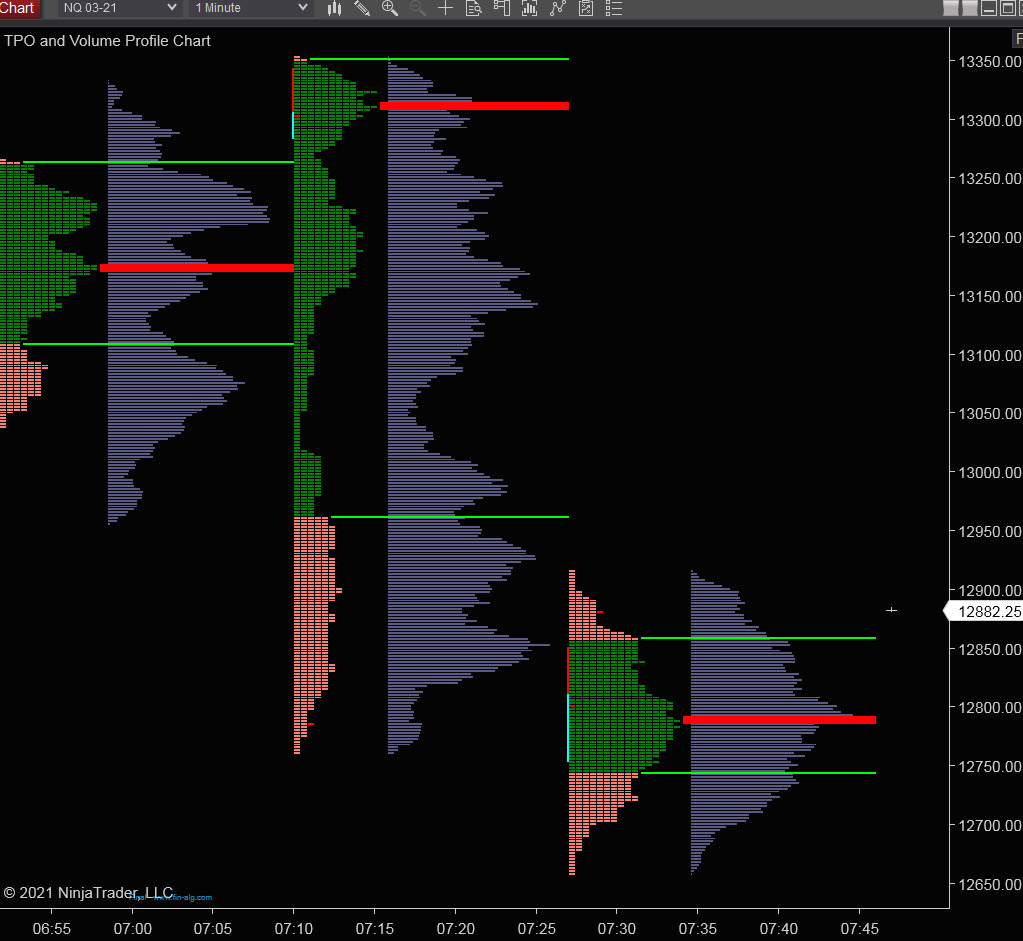
Today is Cycle Day 1 (CD1)…Price has continued its decline fulfilling CD1 Violation Low (12724) . Prior Range was 589.75 handles on 874k contracts exchanged. As such, there are two estimated scenarios to consider for today’s trading.
PVA High Edge = 13344 PVA Low Edge = 12938 Prior POC = 13145
Bull Scenario: IF Bulls sustain a bid above 12850, THEN initial upside estimate targets 12938 – 12982 zone.
Bear Scenario: IF Bears sustain an offer below 12850, THEN initial downside estimate targets 12764 – 12724 zone.
Range Projections and Key Levels (NQ) March 2021 (H) Contract
HOD ATR Range Projection: 12938; LOD ATR Range Projection: 12640; 3 Day Central Pivot: 13082; 10 Day Average True Range: 276; VIX: 28
Trade Strategy: Our tactical trade strategy will simply remain unaltered…We’ll be flexible to trade both long and short side from Decision Pivot Levels. Continue to focus on Bull/Bear Stackers and Premium/Discounts. As always, remaining in alignment with dominant intra-day force increases probabilities of producing winning trades.
Stay Focused…Non-Biased…Disciplined ALWAYS USE STOPS!
Good Trading…David
“Knowing is not enough, We must APPLY. Willing is not enough, We must DO.” –Bruce Lee
*****This trade strategy report is disseminated for “education only” and should not be viewed in any way as a recommendation to buy or sell futures products.”
PAST PERFORMANCE IS NOT NECESSARILY INDICATIVE OF FUTURE RESULTS
IMPORTANT NOTICE! No representation is being made that the use of this strategy or any system or trading methodology will generate profits. Past performance is not necessarily indicative of future results. There is substantial risk of loss associated with trading securities and options on equities. Only risk capital should be used to trade. Trading securities is not suitable for everyone.
Disclaimer: Futures, Options, and Currency trading all have large potential rewards, but they also have large potential risk. You must be aware of the risks and be willing to accept them in order to invest in these markets. Don’t trade with money you can’t afford to lose.
This website is neither a solicitation nor an offer to Buy/Sell futures, options, or currencies. No representation is being made that any account will or is likely to achieve profits or losses similar to those discussed on this web site. The past performance of any trading system or methodology is not necessarily indicative of future results.
CFTC RULE 4.41 –HYPOTHETICAL OR SIMULATED PERFORMANCE RESULTS HAVE CERTAIN LIMITATIONS. UNLIKE AN ACTUAL PERFORMANCE RECORD, SIMULATED RESULTS DO NOT REPRESENT ACTUAL TRADING. ALSO, SINCE THE TRADES HAVE NOT BEEN EXECUTED, THE RESULTS MAY HAVE UNDER-OR-OVER COMPENSATED FOR THE IMPACT, IF ANY, OF CERTAIN MARKET FACTORS, SUCH AS LACK OF LIQUIDITY. SIMULATED TRADING PROGRAMS IN GENERAL ARE ALSO SUBJECT TO THE FACT THAT THEY ARE DESIGNED WITH THE BENEFIT OF HINDSIGHT. NO REPRESENTATION IS BEING MADE THAT ANY ACCOUNT WILL OR IS LIKELY TO ACHIEVE PROFIT OR LOSSES SIMILAR TO THOSE SHOWN