
Markets
Falling by nearly 400 points in the overnight session, Dow futures have pared losses to 115 points, while S&P 500 and Nasdaq futures are down 0.5%.
Dipping into uncharted waters, benchmark 10-year U.S. Treasury bond yields fell below 1.3% for the first time overnight, while the safe-haven yen rallied to 110.17 against the U.S. dollar. CME Group futures suggest at least a 41% chance of a March reduction, a 77% chance the Fed will move by April and a 90% chance of a cut by June.
Even if OPEC slashes production by 600K barrels per day, the price of oil “could still be weak in March and April, before it improves in the summer,” said Kang Wu, head of Asia analytics at S&P Global Platts. “A lot of inventory build up right now needs to be absorbed in April” amid lower crude demand due to the coronavirus outbreak. Oil meanwhile extended declines by 2% to $47/bbl – marking a 52-week low after sliding into correction territory – as some analysts suggested the possibility of a recession in China.
In Asia, Japan -2.1%. Hong Kong +0.3%. China +0.1%. India -0.4%.
In Europe, at midday, London -2.1%. Paris -2.3%. Frankfurt -2.5%.
Futures at 6:20, Dow -0.5%. S&P -0.5%. Nasdaq -0.5%. Crude -2.1% to $47.72. Gold +0.3% to $1648. Bitcoin -4% to $8811.
Ten-year Treasury Yield -2 bps to 1.29%
Source: Seeking Alpha https://seekingalpha.com/
Economic Calendar
8:30 Durable Goods
8:30 GDP Q4
8:30 Initial Jobless Claims
10:00 Pending Home Sales
10:30 EIA Natural Gas Inventory
11:00 Kansas City Fed Mfg Survey
11:30 Fed’s Evans Speech
1:00 PM Results of $32B, 7-Year Note Auction
4:30 PM Money Supply
4:30 PM Fed Balance Sheet
https://www.investing.com/economic-calendar/
***New: PTG Trading Room Chat Log’s Link
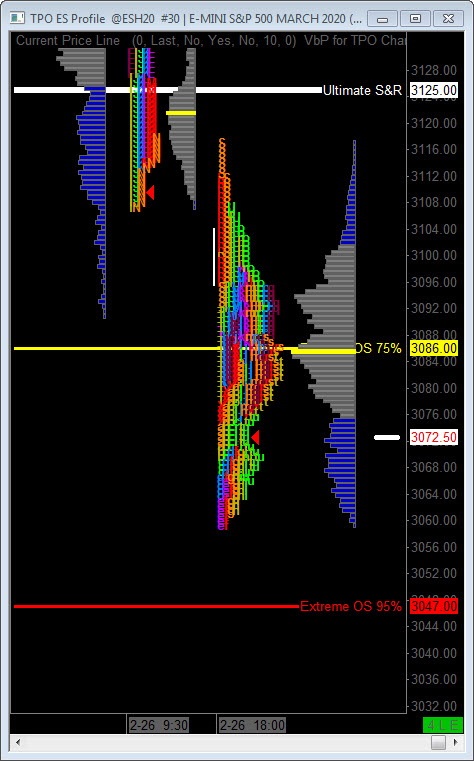
S&P 500
Today is Cycle Day 1 (CD1)…Price extended recent losses below prior low (3091) dipping below 3078 CD1 Violation Level before recovering. Currently trading at this level at time of this writing.
Markets continue to probe for a secure low as two consecutive Cycle Failures carry an ominous implication for markets ahead. Historically when dual failure occurred this has signaled deeper corrective market phase. Notwithstanding history, there have also been “face-ripping” rallies, so keep tight risk controls and ALWAYS HONOR THY STOPS.
ATR Range High = 3125.00 ATR Range Low = 3051.00 CD1 Range Avg = 36.00
Bull Scenario: IF Bulls hold bid above 3085, THEN initial upside estimate targets 3100 – 3125 zone
Bear Scenario: IF Bears hold offer below 3085, THEN initial downside estimate targets 3060 – 3050 zone.
Range Projections and Key Levels (ES) March 2020 (H) Contract
HOD ATR Range Projection: 3125.00; LOD ATR Range Projection: 3051.00; 3 Day Central Pivot: 3182.00; 3 Day Cycle Target: 3100.00; 10 Day Average True Range 65.75; VIX: 29.00
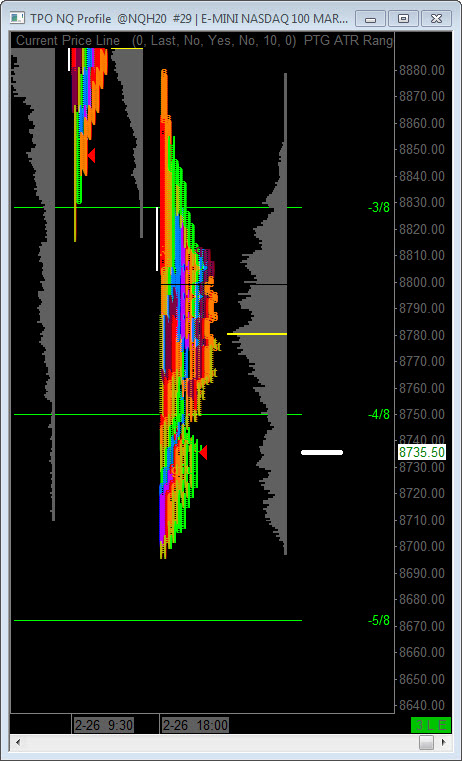
Nasdaq 100 (NQ)
Today is Cycle Day 1 (CD1)…Normal is for a decline measuring 8915.00 (exceeded). Average Range for CD1 is 113.25 handles. Odds of decline > 20 handles = 75% Odds of decline > 25 = 67%
Price is holding within prior range testing 8709.50 prior low during overnight trade. This low is critical for bulls to hold and begin the “repair-process”.
ATR Range High = 8920 ATR Range Low = 8656 CD1 Range Avg = 127.50
Bull Scenario: IF Bulls hold bid above 8709, THEN initial upside estimate targets 8780 – 8822 zone.
Bear Scenario: IF Bears hold offer below 8709, THEN initial downside estimate targets 8678 – 8656 zone.
Range Projections and Key Levels (NQ) March 2020 (H) Contract
HOD ATR Range Projection: 8920.00; LOD ATR Range Projection: 8656.00; 3 Day Central Pivot: 8998.00; 3 Day Cycle Target: 8866.00; 10 Day Average True Range: 222.36; VIX: 29.00
Trade Strategy: Our tactical trade strategy will simply remain unaltered…We’ll be flexible to trade both long and short side from Decision Pivot Levels. Continue to focus on Bull/Bear Stackers and Premium/Discounts. As always, remaining in alignment with dominant intra-day force increases probabilities of producing winning trades.
Stay Focused…Non-Biased…Disciplined ALWAYS USE STOPS!
Good Trading…David
“Knowing is not enough, We must APPLY. Willing is not enough, We must DO.” –Bruce Lee
*****This trade strategy report is disseminated for “education only” and should not be viewed in any way as a recommendation to buy or sell futures products.”
PAST PERFORMANCE IS NOT NECESSARILY INDICATIVE OF FUTURE RESULTS
IMPORTANT NOTICE! No representation is being made that the use of this strategy or any system or trading methodology will generate profits. Past performance is not necessarily indicative of future results. There is substantial risk of loss associated with trading securities and options on equities. Only risk capital should be used to trade. Trading securities is not suitable for everyone.
Disclaimer: Futures, Options, and Currency trading all have large potential rewards, but they also have large potential risk. You must be aware of the risks and be willing to accept them in order to invest in these markets. Don’t trade with money you can’t afford to lose.
This website is neither a solicitation nor an offer to Buy/Sell futures, options, or currencies. No representation is being made that any account will or is likely to achieve profits or losses similar to those discussed on this web site. The past performance of any trading system or methodology is not necessarily indicative of future results.
CFTC RULE 4.41 –HYPOTHETICAL OR SIMULATED PERFORMANCE RESULTS HAVE CERTAIN LIMITATIONS. UNLIKE AN ACTUAL PERFORMANCE RECORD, SIMULATED RESULTS DO NOT REPRESENT ACTUAL TRADING. ALSO, SINCE THE TRADES HAVE NOT BEEN EXECUTED, THE RESULTS MAY HAVE UNDER-OR-OVER COMPENSATED FOR THE IMPACT, IF ANY, OF CERTAIN MARKET FACTORS, SUCH AS LACK OF LIQUIDITY. SIMULATED TRADING PROGRAMS IN GENERAL ARE ALSO SUBJECT TO THE FACT THAT THEY ARE DESIGNED WITH THE BENEFIT OF HINDSIGHT. NO REPRESENTATION IS BEING MADE THAT ANY ACCOUNT WILL OR IS LIKELY TO ACHIEVE PROFIT OR LOSSES SIMILAR TO THOSE SHOWN