
Markets
U.S. stock index futures are ahead by 0.6% as the S&P 500 points to a major inflection point at 2,800, a level widely watched by technical analysts and nearly everyone else. Data yesterday showed gross domestic product rising 2.9% in 2018, just shy of the Trump administration’s 3% target. White House economic advisor Larry Kudlow also said Chinese trade talks between high-level officials had been “fantastic,” and both sides were on track to reach a “remarkable, historic deal.”
In Asia, Japan +1%. Hong Kong +0.6%. China +1.8%. India +0.6%.
In Europe, at midday, London +0.6%. Paris +0.7%. Frankfurt +1.2%.
Futures at 6:20, Dow +0.7%. S&P +0.6%. Nasdaq +0.8%. Crude +0.4% to $57.42. Gold -0.5% to $1310.20. Bitcoin -0.3% to $3807.
Ten-year Treasury Yield +2 bps to 2.73%
(Source: Seeking Alpha)
Economic Calendar
8:30Personal Income and Outlays
9:45PMI Manufacturing Index
10:00ISM Manufacturing Index
10:00Consumer Sentiment
12:50 PMFed’s Bostic: Economic Outlook and Monetary Policy
1:00 PMBaker-Hughes Rig Count
*****New PTG Trading Room Chat Log’s Link
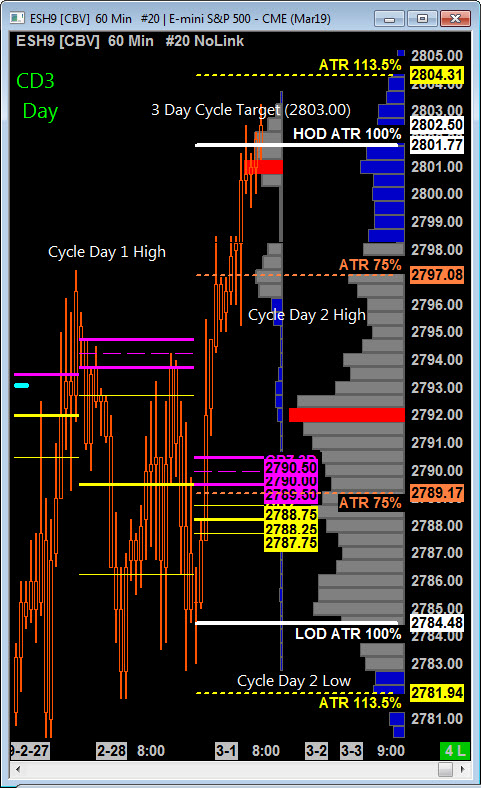
S&P 500
Today is Cycle Day 3 (CD3)…Price is rallying in GLOBEX trade fulfilling 2803 3 Day Cycle. Further upside is possible IF bulls convert to upper support.
CD3 Range High = 2806.50 CD3 Range Low = 2780.00 CD3 Range Avg = 23.50
Scenario 1: IF price holds bid above 2790.00, THEN initial upside target measures 2800 – 2805 3 Day Cycle Target Zone.
Scenario 2: IF price holds offer below 2790.00, THEN initial downside target measures 2785 – 2780 ATR Range Low Zone.
Range Projections and Key Levels (ES) March (H) Contract
HOD ATR Range Projection: 2802.00; LOD ATR Range Projection: 2784.50; Cycle Day 1 Low: 2775.00; 3 Day Central Pivot: 2790.00; 3 Day Cycle Target: 2803.00; 10 Day Average True Range 19.00; VIX: 14.50
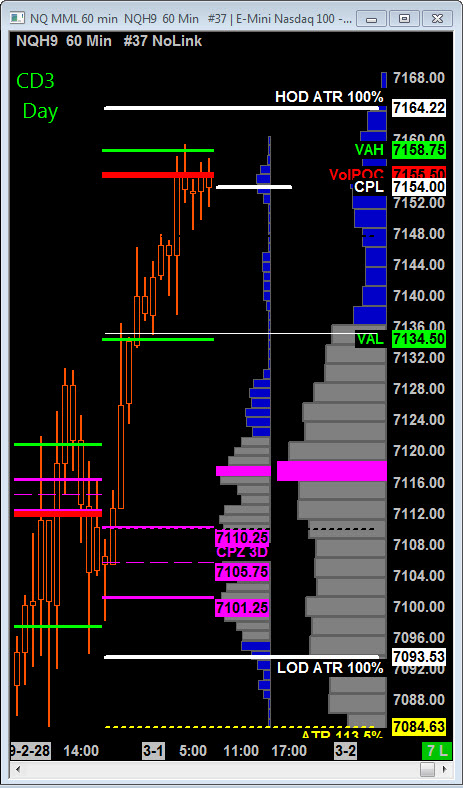
Nasdaq 100 (NQ)
Today is Cycle Day 3 …Price is rallying in GLOBEX trade fulfilling 7115.50 Day Cycle, continuing to push higher reaching 7152 – 7154 CD3 Penetration Zone.
CD3 Range High = 7154.50 CD3 Range Low = 7103.50 CD3 Range Avg = 56.00
Scenario 1: IF price holds bid above 7130.75, THEN initial upside potential targets 7152.00 – 7154.00 CD3 Penetration Zone.
Scenario 2: IF price holds offer below 7130.75, THEN initial downside targets 7110.25 – 7101.25 3 Day Central Pivot Zone.
Range Projections and Key Levels (NQ) March (H) Contract
HOD ATR Range Projection: 7164.25; LOD ATR Range Projection: 7093.50; Cycle Day 1 Low: 7048.00; 3 Day Central Pivot: 7706.00; 3 Day Cycle Target: 7115.50; 10 Day Average True Range: 66.00; VIX: 14.50
Trade Strategy: Our tactical trade strategy will simply remain unaltered…We’ll be flexible to trade both long and short side from Decision Pivot Levels. Continue to focus on Bull/Bear Stackers and Premium/Discounts. As always, remaining in alignment with dominant intra-day force increases probabilities of producing winning trades.
Stay Focused…Non-Biased…Disciplined ALWAYS USE STOPS!
Good Trading…David
“Knowing is not enough, We must APPLY. Willing is not enough, We must DO.” –Bruce Lee
*****This trade strategy report is disseminated for “education only” and should not be viewed in any way as a recommendation to buy or sell futures products.”
PAST PERFORMANCE IS NOT NECESSARILY INDICATIVE OF FUTURE RESULTS
IMPORTANT NOTICE! No representation is being made that the use of this strategy or any system or trading methodology will generate profits. Past performance is not necessarily indicative of future results. There is substantial risk of loss associated with trading securities and options on equities. Only risk capital should be used to trade. Trading securities is not suitable for everyone.
Disclaimer: Futures, Options, and Currency trading all have large potential rewards, but they also have large potential risk. You must be aware of the risks and be willing to accept them in order to invest in these markets. Don’t trade with money you can’t afford to lose.
This website is neither a solicitation nor an offer to Buy/Sell futures, options, or currencies. No representation is being made that any account will or is likely to achieve profits or losses similar to those discussed on this web site. The past performance of any trading system or methodology is not necessarily indicative of future results.
CFTC RULE 4.41 –HYPOTHETICAL OR SIMULATED PERFORMANCE RESULTS HAVE CERTAIN LIMITATIONS. UNLIKE AN ACTUAL PERFORMANCE RECORD, SIMULATED RESULTS DO NOT REPRESENT ACTUAL TRADING. ALSO, SINCE THE TRADES HAVE NOT BEEN EXECUTED, THE RESULTS MAY HAVE UNDER-OR-OVER COMPENSATED FOR THE IMPACT, IF ANY, OF CERTAIN MARKET FACTORS, SUCH AS LACK OF LIQUIDITY. SIMULATED TRADING PROGRAMS IN GENERAL ARE ALSO SUBJECT TO THE FACT THAT THEY ARE DESIGNED WITH THE BENEFIT OF HINDSIGHT. NO REPRESENTATION IS BEING MADE THAT ANY ACCOUNT WILL OR IS LIKELY TO ACHIEVE PROFIT OR LOSSES SIMILAR TO THOSE SHOWN