
Markets
There’s another positive session in store for Wall Street, with U.S. stock index futures pointing to gains of 0.3%. Market focus is largely attuned to central bank expectations, with the Fed due to kick-off its two-day policy meeting later in the session. Most investors expect the FOMC to strike a dovish tone and lower its “dot plot” to show little or no further tightening in 2019.
In Asia, Japan -0.1%. Hong Kong +0.2%. China -0.2%. India +0.7%.
In Europe, at midday, London +0.4%. Paris +0.5%. Frankfurt +0.8%.
Futures at 6:20, Dow +0.3%. S&P +0.3%. Nasdaq +0.3%. Crude +0.6% to $59.76. Gold +0.6% to $1308.80. Bitcoin +0.8% to $4001.
Ten-year Treasury Yield flat at 2.59%
(Source: Seeking Alpha)
Economic Calendar
FOMC meeting begins
8:55Redbook Chain Store Sales
10:00Factory Orders
*****New PTG Trading Room Chat Log’s Link
S&P 500
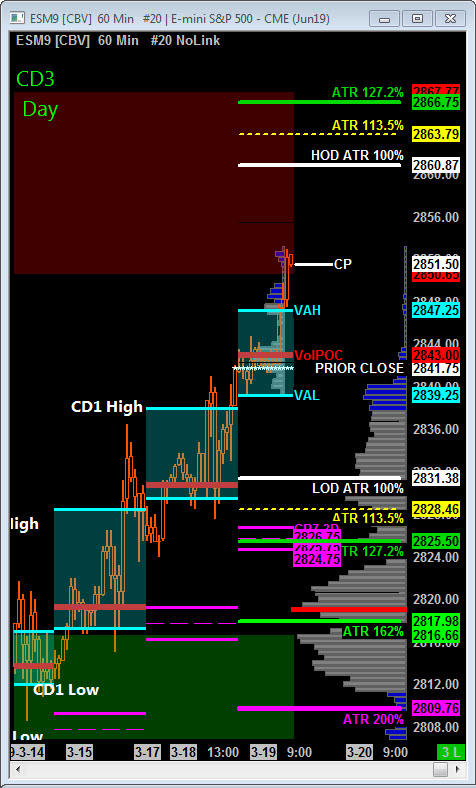
Today is Cycle Day 3 (CD3)…Price has vaulted higher pre-RTH above prior high and has fulfilled initial upside target 2850.50 CD3 Penetration Level. Further upside measures 2859.25 – 2862.75 ATR Cycle Range Zone.
CD3 Range High = 2862.75 CD3 Range Low = 2829.50 CD3 Range Avg = 23.50
Scenario 1: IF Bulls hold bid above 2842.00, THEN initial upside target measures 2851 CD3 Penetration Level.
Scenario 2: IF Bears hold offer below 2842.00, THEN initial downside target measures 2836 – 2833 zone.
Range Projections and Key Levels (ES) June (M) Contract
HOD ATR Range Projection: 2861.00; LOD ATR Range Projection: 2831.50; Cycle Day 1 Low: 2812.50; 3 Day Central Pivot: 2825.00; 3 Day Cycle Target: 2840.25; 10 Day Average True Range 22.00; VIX: 12.67
Nasdaq 100 (NQ)
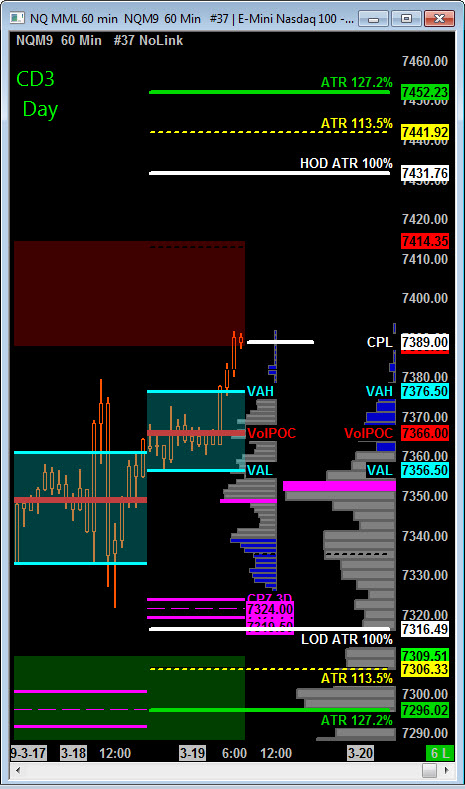
Today is Cycle Day 3 …Price has pushed higher in pre-RTH trade above prior high and closing in on initial target 7401 CD3 Penetration Level.
CD3 Range High = 7412.00 CD3 Range Low = 7335.50 CD3 Range Avg = 56.50
Scenario 1: IF Bulls hold bid above 7379.50, THEN initial upside potential targets 7401.00 – 7412.00 CD3 Range Penetration Zone.
Scenario 2: IF Bears hold offer below 7379.50, THEN initial downside targets 7335.50 – 7325.00 3 Day Central Pivot Zone.
Range Projections and Key Levels (NQ) June (M) Contract
HOD ATR Range Projection: 7431.75; LOD ATR Range Projection: 7316.50; Cycle Day 1 Low: 7284.50; 3 Day Central Pivot: 7325.00; 3 Day Cycle Target: 7352.25; 10 Day Average True Range: 76.00; VIX: 12.67
Trade Strategy: Our tactical trade strategy will simply remain unaltered…We’ll be flexible to trade both long and short side from Decision Pivot Levels. Continue to focus on Bull/Bear Stackers and Premium/Discounts. As always, remaining in alignment with dominant intra-day force increases probabilities of producing winning trades.
Stay Focused…Non-Biased…Disciplined ALWAYS USE STOPS!
Good Trading…David
“Knowing is not enough, We must APPLY. Willing is not enough, We must DO.” –Bruce Lee
*****This trade strategy report is disseminated for “education only” and should not be viewed in any way as a recommendation to buy or sell futures products.”
PAST PERFORMANCE IS NOT NECESSARILY INDICATIVE OF FUTURE RESULTS
IMPORTANT NOTICE! No representation is being made that the use of this strategy or any system or trading methodology will generate profits. Past performance is not necessarily indicative of future results. There is substantial risk of loss associated with trading securities and options on equities. Only risk capital should be used to trade. Trading securities is not suitable for everyone.
Disclaimer: Futures, Options, and Currency trading all have large potential rewards, but they also have large potential risk. You must be aware of the risks and be willing to accept them in order to invest in these markets. Don’t trade with money you can’t afford to lose.
This website is neither a solicitation nor an offer to Buy/Sell futures, options, or currencies. No representation is being made that any account will or is likely to achieve profits or losses similar to those discussed on this web site. The past performance of any trading system or methodology is not necessarily indicative of future results.
CFTC RULE 4.41 –HYPOTHETICAL OR SIMULATED PERFORMANCE RESULTS HAVE CERTAIN LIMITATIONS. UNLIKE AN ACTUAL PERFORMANCE RECORD, SIMULATED RESULTS DO NOT REPRESENT ACTUAL TRADING. ALSO, SINCE THE TRADES HAVE NOT BEEN EXECUTED, THE RESULTS MAY HAVE UNDER-OR-OVER COMPENSATED FOR THE IMPACT, IF ANY, OF CERTAIN MARKET FACTORS, SUCH AS LACK OF LIQUIDITY. SIMULATED TRADING PROGRAMS IN GENERAL ARE ALSO SUBJECT TO THE FACT THAT THEY ARE DESIGNED WITH THE BENEFIT OF HINDSIGHT. NO REPRESENTATION IS BEING MADE THAT ANY ACCOUNT WILL OR IS LIKELY TO ACHIEVE PROFIT OR LOSSES SIMILAR TO THOSE SHOWN