
Markets
Big gains were seen across every asset class overnight as policymakers pulled out all the stops and adopted a “whatever it takes” approach to mitigate economic fallout from COVID-19. The latest moves will see the Fed increase the access to dollars to global central banks grappling with liquidity shortages, while governments around the world pledged or are considering as much as $3T in fiscal support.
Source: Seeking Alpha https://seekingalpha.com/
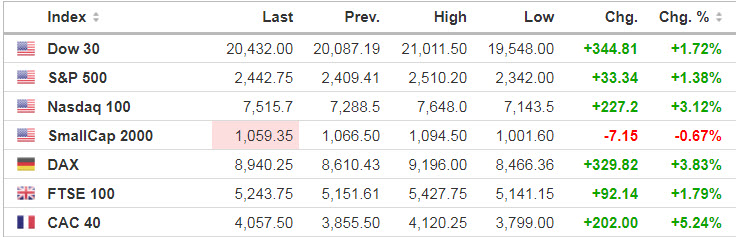
Source: https://www.investing.com/indices/indices-cfds
Economic Calendar
10:00 Existing Home Sales
1:00 PM Baker-Hughes Rig Count
https://www.investing.com/economic-calendar/
***New: PTG Trading Room Chat Log’s Link
S&P 500
Prior Session was Cycle Day 1 (CD1)…Normal / Extreme Normal CD1 decline as price notched a higher CD1 Low than prior CD3 Low. This was a bullish intra-day signal.
We stated in prior DTS Briefing 3.19.20: “… markets are desperately seeking some type of stabilization and calmness.”
During overnight trade, Nasdaq futures jumped nearly 5% to hit a ‘limit up’ level on the news, while oil is ahead by 6% and gold is 2% higher. Don’t forget that it’s also quad witching day, which can lead to higher volatility and more trading volume.
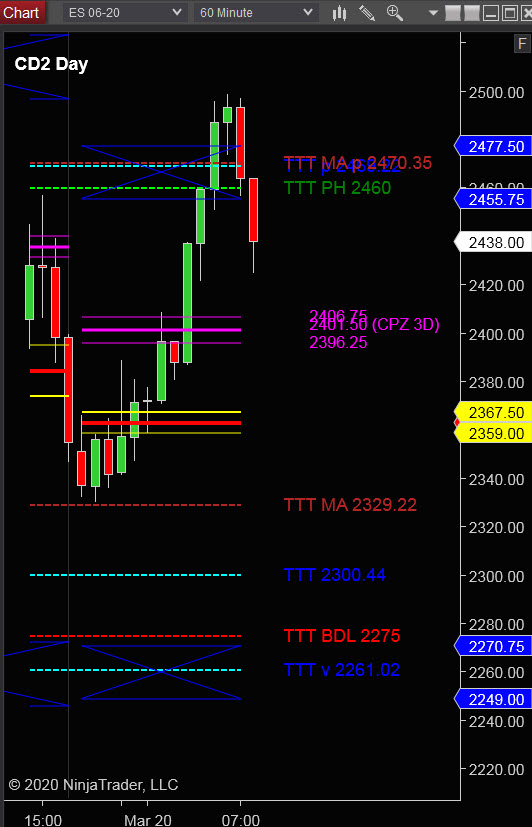
This leads us into today’s Cycle Day 2 (CD2)…Price has rallied off the “secure” Cycle Day 1 Low (2275), reaching and exceeding Cycle Statistical Extreme Zone between 2465 – 2475.
P – VA High = 2440 P – VA Low = 2385 P – POC = 2406
Bull Scenario: IF Bulls hold bid above 2400, THEN initial upside estimate targets 2465 – 2475 zone
Bear Scenario: IF Bears hold offer below 2400, THEN initial downside estimate targets 2380 – 2350 zone.
Range Projections and Key Levels (ES) June 2020 (M) Contract
HOD ATR Range Projection: 2542.00; LOD ATR Range Projection: 2286.00 3 Day Central Pivot: 2400.00; 3 Day Cycle Target: 2390.00; 10 Day Average True Range 206; VIX: 68
Nasdaq 100 (NQ)
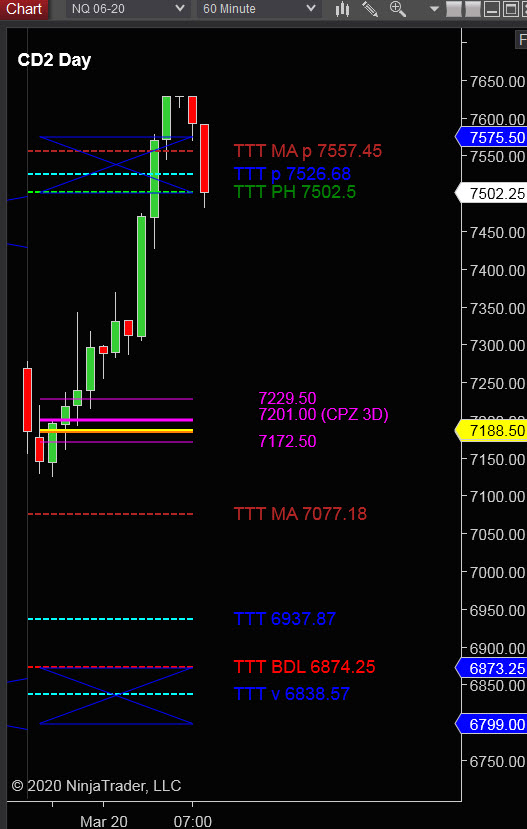
Today is Cycle Day 2 (CD2)…During overnight trade, Nasdaq futures jumped nearly 5% to hit a ‘limit up, reaching and exceeding Cycle Statistical Extreme Zone between 7513 – 7590.
P – VA High = 7435 P – VA Low = 7263 P – POC = 7323
Bull Scenario: IF Bulls hold bid above 7502, THEN initial upside estimate targets 7513 – 7590 zone.
Bear Scenario: IF Bears hold offer below 7502, THEN initial downside estimate targets 7436 – 7323 zone.
Range Projections and Key Levels (NQ) June 2020 (M) Contract
HOD ATR Range Projection: 7530.00; LOD ATR Range Projection: 7226.00; 3 Day Central Pivot: 7200.00; 3 Day Cycle Target: 7342.00; 10 Day Average True Range: 593; VIX: 68
Trade Strategy: Our tactical trade strategy will simply remain unaltered…We’ll be flexible to trade both long and short side from Decision Pivot Levels. Continue to focus on Bull/Bear Stackers and Premium/Discounts. As always, remaining in alignment with dominant intra-day force increases probabilities of producing winning trades.
Stay Focused…Non-Biased…Disciplined ALWAYS USE STOPS!
Good Trading…David
“Knowing is not enough, We must APPLY. Willing is not enough, We must DO.” –Bruce Lee
*****This trade strategy report is disseminated for “education only” and should not be viewed in any way as a recommendation to buy or sell futures products.”
PAST PERFORMANCE IS NOT NECESSARILY INDICATIVE OF FUTURE RESULTS
IMPORTANT NOTICE! No representation is being made that the use of this strategy or any system or trading methodology will generate profits. Past performance is not necessarily indicative of future results. There is substantial risk of loss associated with trading securities and options on equities. Only risk capital should be used to trade. Trading securities is not suitable for everyone.
Disclaimer: Futures, Options, and Currency trading all have large potential rewards, but they also have large potential risk. You must be aware of the risks and be willing to accept them in order to invest in these markets. Don’t trade with money you can’t afford to lose.
This website is neither a solicitation nor an offer to Buy/Sell futures, options, or currencies. No representation is being made that any account will or is likely to achieve profits or losses similar to those discussed on this web site. The past performance of any trading system or methodology is not necessarily indicative of future results.
CFTC RULE 4.41 –HYPOTHETICAL OR SIMULATED PERFORMANCE RESULTS HAVE CERTAIN LIMITATIONS. UNLIKE AN ACTUAL PERFORMANCE RECORD, SIMULATED RESULTS DO NOT REPRESENT ACTUAL TRADING. ALSO, SINCE THE TRADES HAVE NOT BEEN EXECUTED, THE RESULTS MAY HAVE UNDER-OR-OVER COMPENSATED FOR THE IMPACT, IF ANY, OF CERTAIN MARKET FACTORS, SUCH AS LACK OF LIQUIDITY. SIMULATED TRADING PROGRAMS IN GENERAL ARE ALSO SUBJECT TO THE FACT THAT THEY ARE DESIGNED WITH THE BENEFIT OF HINDSIGHT. NO REPRESENTATION IS BEING MADE THAT ANY ACCOUNT WILL OR IS LIKELY TO ACHIEVE PROFIT OR LOSSES SIMILAR TO THOSE SHOWN