
Markets
Up by nearly 3% for most of the night, stock index futures turned negative moments ago following Tuesday’s historic rally. The DJIA climbed more than 2,000 points, or 11.4%, marking its biggest percentage gain since 1933, while the S&P 500 soared 9.4% for its best day since October 2008.
Source: Seeking Alpha https://seekingalpha.com/
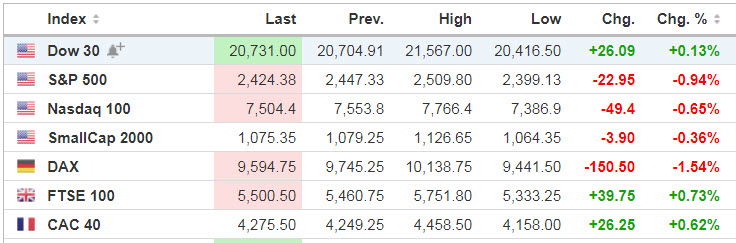
Source: https://www.investing.com/indices/indices-cfds
Economic Calendar
8:30 Durable Goods
9:00 FHFA House Price Index
10:00 State Street Investor Confidence Index
10:30 EIA Petroleum Inventories
11:00 Survey of Business Uncertainty
11:30 Results of $18B, 2-Year FRN Auction
1:00 PM Results of $41B, 5-Year Note Auction
https://www.investing.com/economic-calendar/
***New: PTG Trading Room Chat Log’s Link
S&P 500
*****To place the 3 Day Cycle into proper context, it’s important to discuss the “cycle transition” from day-to-day. That is, we cannot assess each cycle day independently without referencing the adjacent cycle days.
PTG Briefing Note (Monday) to subscribers stated: “Prior Session was Cycle Day 3 (CD3)…Price fulfilled Positive 3 Day Cycle Statistics early in the session following FED’s announcement, but quickly faded, retesting session lows. Firm bid into the closing rotation set the tone for a continuation rally as we previewed this Scenario with PTG’s Live Trading Room Community.”
From our Trading Room (Monday Night): >>PTGDavid:(10:00:39 PM): @ES Looking good during Asian Session…Bullish Bids abound…Price holding and rallying from Prior VAH>>>One of the bullish scenarios we covered prepping for Cycle Day 1
…Transition from Cycle Day 3 to Cycle Day 1
Tuesday’s Session was Cycle Day 1…Normal for CD1 is some magnitude decline. Strong bids squelched any decline as price rallied to “limit-up” and into the 3 Day Central Pivot Zone between 2300 – 2342. Bulls will need to convert this zone to support in order to continue the current rally. Further upside target 2360…2386…2400 Roundie
…Transition from Cycle Day 1 to Cycle Day 2
This leads us into today’s Cycle Day 2…Price gapped higher in the prior session and never looked back, continuing the rally which actually began during Cycle Day 3 “limit-down” to 2173.75. Price has fulfilled CD2 Upper Penetration target of 2460.65 as well as clearing the all-important 3 Day Central Pivot Zone. Bulls will need to hold any back-test of this zone should selling materialize. Further upside hurdles remain, but if this is the beginning of the “repair-process” and not simply a “dead-cat” bounce, then Bulls will need to prove their metal.
P – VA High = 2410 P – VA Low = 2360 P – POC = 2375
Bull Scenario: IF Bulls hold bid above 2416, THEN initial upside estimate targets 2460 – 2490 zone
Bear Scenario: IF Bears hold offer below 2416, THEN initial downside estimate targets 2375 – 2350 zone.
Range Projections and Key Levels (ES) June 2020 (M) Contract
HOD ATR Range Projection: 2565.00; LOD ATR Range Projection: 2320.00 3 Day Central Pivot: 2325.00; 3 Day Cycle Target: 2295.00; 10 Day Average True Range 179.00; VIX: 68

Nasdaq 100 (NQ)
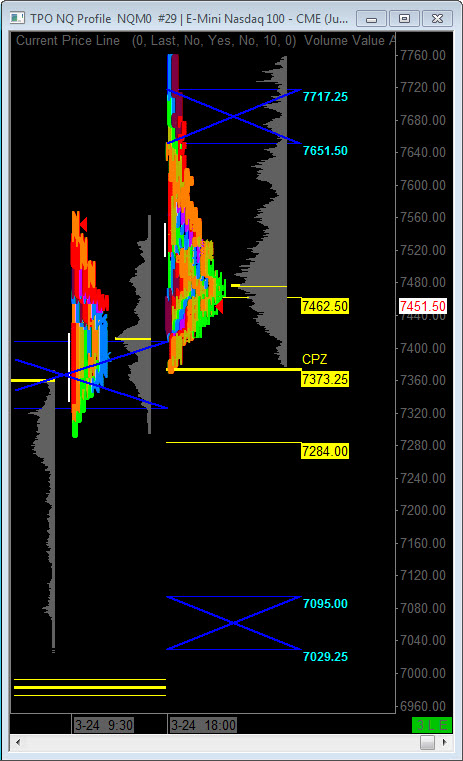
Today is Cycle Day 2 (CD2)…Overnight rally which fulfilled CD2 Upper Penetration Targets (7596 – 7632) has faded pre-RTH back to 7490 POC. Expectation for today is for some “back n fill” with a positive skew to hold recent rally.
P – VA High = 7465 P – VA Low = 7355 P – POC = 7430
Bull Scenario: IF Bulls hold bid above 7412, THEN initial upside estimate targets 7596 – 7632 zone.
Bear Scenario: IF Bears hold offer below 7412, THEN initial downside estimate targets 7390 – 7355 zone.
Range Projections and Key Levels (NQ) June 2020 (M) Contract
HOD ATR Range Projection: 7922.00; LOD ATR Range Projection: 7212.00; 3 Day Central Pivot: 7168.00; 3 Day Cycle Target: 7243.00; 10 Day Average True Range: 545; VIX: 68
Trade Strategy: Our tactical trade strategy will simply remain unaltered…We’ll be flexible to trade both long and short side from Decision Pivot Levels. Continue to focus on Bull/Bear Stackers and Premium/Discounts. As always, remaining in alignment with dominant intra-day force increases probabilities of producing winning trades.
Stay Focused…Non-Biased…Disciplined ALWAYS USE STOPS!
Good Trading…David
“Knowing is not enough, We must APPLY. Willing is not enough, We must DO.” –Bruce Lee
*****This trade strategy report is disseminated for “education only” and should not be viewed in any way as a recommendation to buy or sell futures products.”
PAST PERFORMANCE IS NOT NECESSARILY INDICATIVE OF FUTURE RESULTS
IMPORTANT NOTICE! No representation is being made that the use of this strategy or any system or trading methodology will generate profits. Past performance is not necessarily indicative of future results. There is substantial risk of loss associated with trading securities and options on equities. Only risk capital should be used to trade. Trading securities is not suitable for everyone.
Disclaimer: Futures, Options, and Currency trading all have large potential rewards, but they also have large potential risk. You must be aware of the risks and be willing to accept them in order to invest in these markets. Don’t trade with money you can’t afford to lose.
This website is neither a solicitation nor an offer to Buy/Sell futures, options, or currencies. No representation is being made that any account will or is likely to achieve profits or losses similar to those discussed on this web site. The past performance of any trading system or methodology is not necessarily indicative of future results.
CFTC RULE 4.41 –HYPOTHETICAL OR SIMULATED PERFORMANCE RESULTS HAVE CERTAIN LIMITATIONS. UNLIKE AN ACTUAL PERFORMANCE RECORD, SIMULATED RESULTS DO NOT REPRESENT ACTUAL TRADING. ALSO, SINCE THE TRADES HAVE NOT BEEN EXECUTED, THE RESULTS MAY HAVE UNDER-OR-OVER COMPENSATED FOR THE IMPACT, IF ANY, OF CERTAIN MARKET FACTORS, SUCH AS LACK OF LIQUIDITY. SIMULATED TRADING PROGRAMS IN GENERAL ARE ALSO SUBJECT TO THE FACT THAT THEY ARE DESIGNED WITH THE BENEFIT OF HINDSIGHT. NO REPRESENTATION IS BEING MADE THAT ANY ACCOUNT WILL OR IS LIKELY TO ACHIEVE PROFIT OR LOSSES SIMILAR TO THOSE SHOWN