
Markets
More pain will come at the open, with Dow futures sinking 652 points and the S&P 500 and Nasdaq down 2.7% and 2.9%, respectively. The spread of coronavirus has accelerated in the U.S., and investors who once downplayed down the virus are now re-assessing risks.
The 10-year Treasury yield hit an all-time low of 0.694% overnight as the coronavirus continued to push investors into the safety of government bonds.
In Asia, Japan -2.7%. Hong Kong -2.3%. China -1.2%. India -2.3%.
In Europe, at midday, London -3.2%. Paris -3.8%. Frankfurt -3.5%.
Futures at 6:20, Dow -2.5%. S&P -2.7%. Nasdaq -2.9%. Crude -4.6% to $43.78. Gold +1% to $1684.10. Bitcoin +0.7% to $9168.
Ten-year Treasury Yield -2 bps to 0.75%
Source: Seeking Alpha https://seekingalpha.com/
Economic Calendar
10:00 Wholesale Trade
1:00 PM Baker-Hughes Rig Count
https://www.investing.com/economic-calendar/
***New: PTG Trading Room Chat Log’s Link
S&P 500
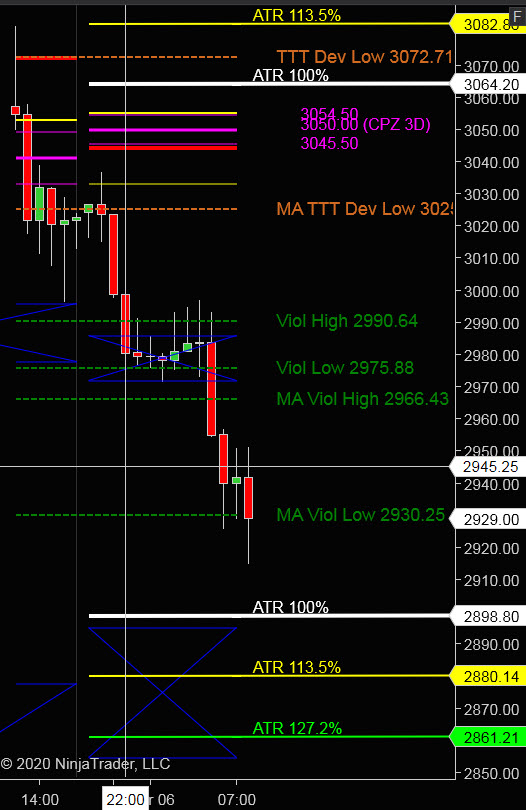
Today is Cycle Day 1 (CD1)…After reaching CD3 Penetration Target (3128) and retracement “semi” – stabilization, price has once again taken a “nose-dive on continued fears of spreading COVD-19.
Price is currently trading sub 2930 handle which is Cycle Day 1 Maximum Statistical Extreme Violation Level. (That’s a mouthful!) Suffice-it-to-say >> EXTREME. 5-Day Average True Range (133) measures 2900. VIX = 47
We’ll keep the “High Surf Warning” for today’s session.

ATR Range High = 3064 ATR Range Low = 2898 ATR Range Avg = 133
Bull Scenario: IF Bulls hold bid above 2930, THEN initial upside estimate targets 2975 – 2990 zone
Bear Scenario: IF Bears hold offer below 2930, THEN initial downside estimate targets 2910 – 2900 zone.
Range Projections and Key Levels (ES) March 2020 (H) Contract
HOD ATR Range Projection: 3064.00; LOD ATR Range Projection: 2898.00; 3 Day Central Pivot: 3050.00; 3 Day Cycle Target: 3110.00; 10 Day Average True Range 133.00; VIX: 47.00
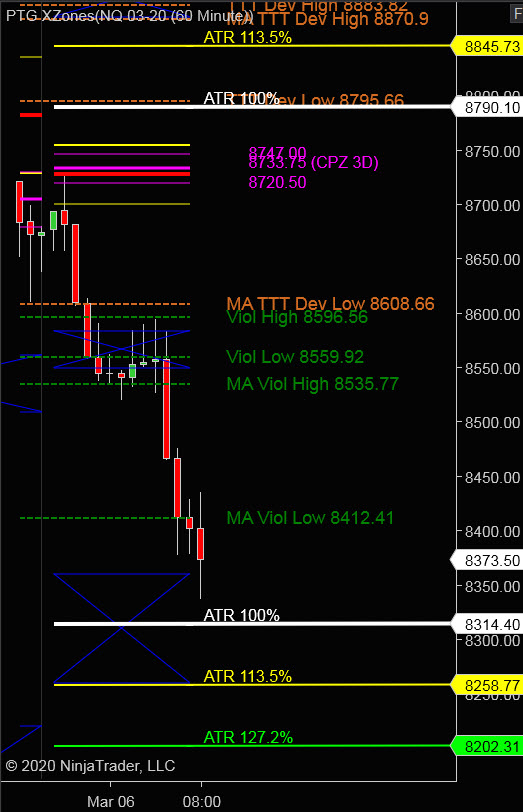
Nasdaq 100 (NQ)
Today is Cycle Day 1 (CD1)…Price is currently trading sub 8412 handle which is Cycle Day 1 Maximum Statistical Extreme Violation Level. (That’s a mouthful!) Suffice-it-to-say >> EXTREME. 5-Day Average True Range (133) measures 2900. VIX = 45
VA Range High = 8606 VA Range Low = 8400 CD1 Range Avg = 166.00
Bull Scenario: IF Bulls hold bid above 8412, THEN initial upside estimate targets 8535 – 8595 zone.
Bear Scenario: IF Bears hold offer below 8412, THEN initial downside estimate targets 8314 – 8258 zone.
Range Projections and Key Levels (NQ) March 2020 (H) Contract
HOD ATR Range Projection: 8790.00; LOD ATR Range Projection: 8314.00; 3 Day Central Pivot: 8734.00; 3 Day Cycle Target: 8845.00; 10 Day Average True Range: 373.00; VIX: 47.00
Trade Strategy: Our tactical trade strategy will simply remain unaltered…We’ll be flexible to trade both long and short side from Decision Pivot Levels. Continue to focus on Bull/Bear Stackers and Premium/Discounts. As always, remaining in alignment with dominant intra-day force increases probabilities of producing winning trades.
Stay Focused…Non-Biased…Disciplined ALWAYS USE STOPS!
Good Trading…David
“Knowing is not enough, We must APPLY. Willing is not enough, We must DO.” –Bruce Lee
*****This trade strategy report is disseminated for “education only” and should not be viewed in any way as a recommendation to buy or sell futures products.”
PAST PERFORMANCE IS NOT NECESSARILY INDICATIVE OF FUTURE RESULTS
IMPORTANT NOTICE! No representation is being made that the use of this strategy or any system or trading methodology will generate profits. Past performance is not necessarily indicative of future results. There is substantial risk of loss associated with trading securities and options on equities. Only risk capital should be used to trade. Trading securities is not suitable for everyone.
Disclaimer: Futures, Options, and Currency trading all have large potential rewards, but they also have large potential risk. You must be aware of the risks and be willing to accept them in order to invest in these markets. Don’t trade with money you can’t afford to lose.
This website is neither a solicitation nor an offer to Buy/Sell futures, options, or currencies. No representation is being made that any account will or is likely to achieve profits or losses similar to those discussed on this web site. The past performance of any trading system or methodology is not necessarily indicative of future results.
CFTC RULE 4.41 –HYPOTHETICAL OR SIMULATED PERFORMANCE RESULTS HAVE CERTAIN LIMITATIONS. UNLIKE AN ACTUAL PERFORMANCE RECORD, SIMULATED RESULTS DO NOT REPRESENT ACTUAL TRADING. ALSO, SINCE THE TRADES HAVE NOT BEEN EXECUTED, THE RESULTS MAY HAVE UNDER-OR-OVER COMPENSATED FOR THE IMPACT, IF ANY, OF CERTAIN MARKET FACTORS, SUCH AS LACK OF LIQUIDITY. SIMULATED TRADING PROGRAMS IN GENERAL ARE ALSO SUBJECT TO THE FACT THAT THEY ARE DESIGNED WITH THE BENEFIT OF HINDSIGHT. NO REPRESENTATION IS BEING MADE THAT ANY ACCOUNT WILL OR IS LIKELY TO ACHIEVE PROFIT OR LOSSES SIMILAR TO THOSE SHOWN