
Markets (Top Stories)

Economic Calendar
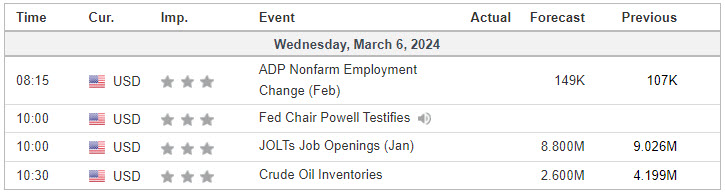
https://www.investing.com/economic-calendar/
S&P 500

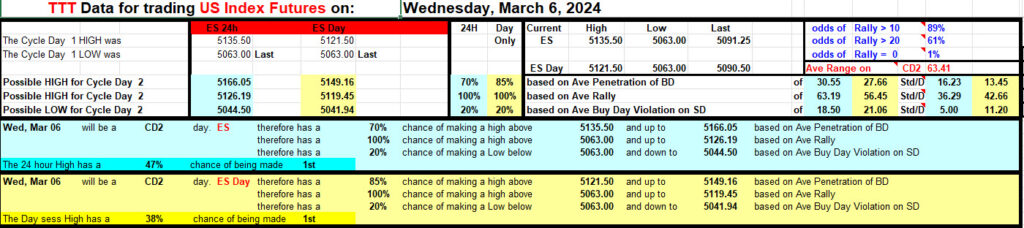
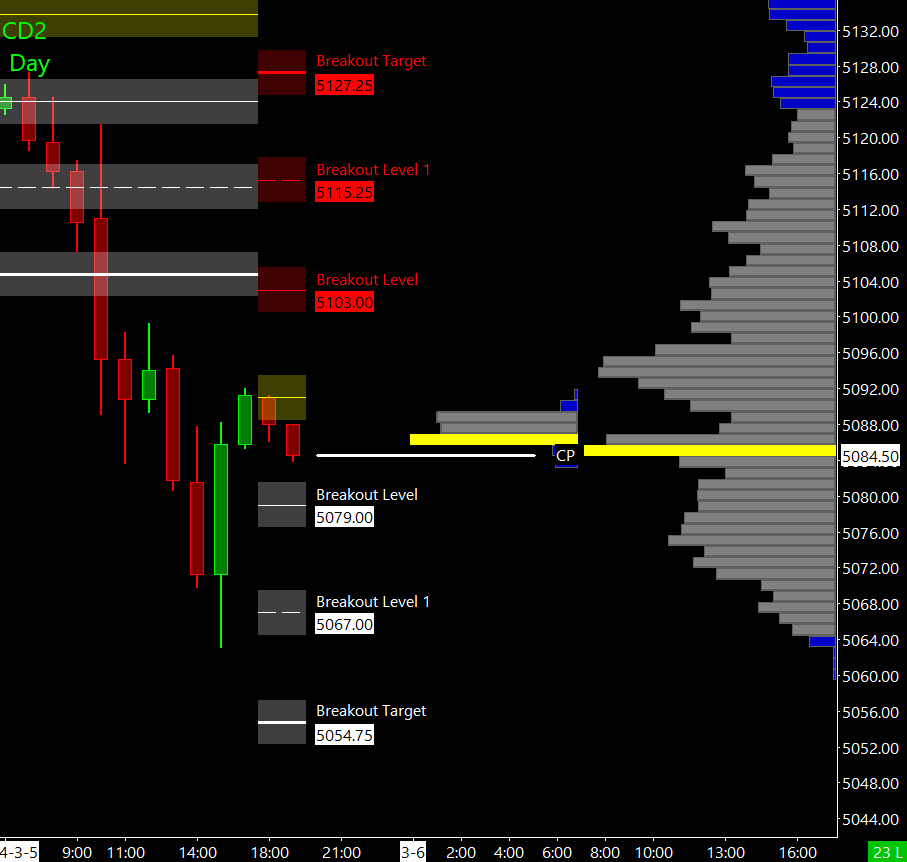
Prior Session was Cycle Day 1: Failure on Cycle Day 3 (see DTS Briefing 3.5.24) set up today’s long liquidation decline, pushing price down to retest 5064 range projection and previous Cycle Buy Day Low. Final hour short-cover rally back to 5090 Point of Control (POC). Range was 72 handles on 1.767M contracts exchanged.
…Transition from Cycle Day 1 to Cycle Day 2
This leads us into Cycle Day 2: Anticipation for today’s trade is for MATD – “Morning/Market After Trend Day” rhythms. New Cycle Day 1 (Buy Day) Low is established at 5063. Back test of this level for surety is expected at some point before a sustainable cycle rally can unfold.
As always, our tactical trade plan remains unchanged…Stay in alignment with dominant intra-day forces.
Scenarios to consider for today’s trading.
Bull Scenario: Price sustains a bid above 5090, initially targets 5100 – 5105 zone.
Bear Scenario: Price sustains an offer below 5090, initially targets 5080 – 5075 zone.
PVA High Edge = 5145 PVA Low Edge = 5136 Prior POC = 5140
PTG 3 Day Cycle
EXCLUSIVE OFFER

*****The 3 Day Cycle has a 90% probability of fulfilling Positive Cycle Statistics covering 12 years of recorded tracking history.
Range Projections (ES) March 2024 (H)
- BULL ATR Range Projection >>> 5136
- BEAR ATR Range Projection >>> 5040
Nasdaq 100 (NQ)

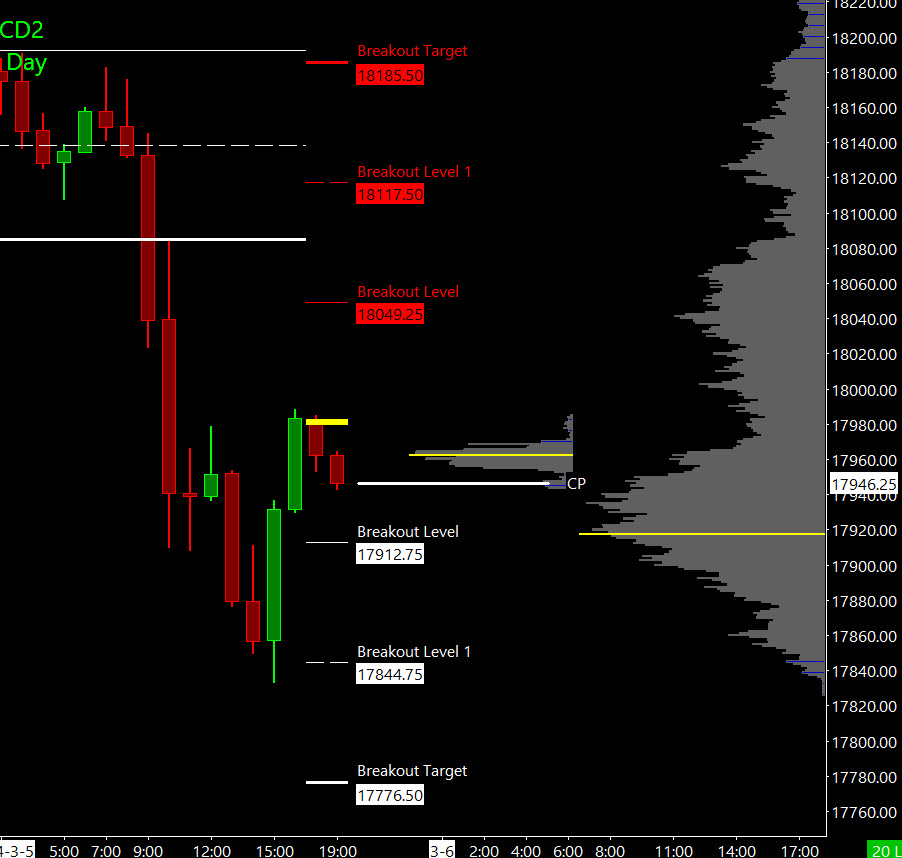
Prior Session was Cycle Day 1: Weakness which began on Cycle Day 3 (see DTS Briefing 3.5.24) spilled-over setting up today’s long liquidation decline. Final hour short-cover rally back to 17985 Midpoint. Range was 419 handles on 785k contracts exchanged.
…Transition from Cycle Day 1 to Cycle Day 2
This leads us into Cycle Day 2: Anticipation for today’s trade is for MATD – “Morning/Market After Trend Day” rhythms. New Cycle Day 1 (Buy Day) Low is established at 17832.50. Back test of this level for surety is expected at some point before a sustainable cycle rally can unfold.
As always, our tactical trade plan remains unchanged…Stay in alignment with dominant intra-day forces.
Scenarios to consider for today’s trading.
Bull Scenario: Price sustains a bid above 17985, initially targets 18020 – 18040 zone.
Bear Scenario: Price sustains an offer below 17985, initially targets 17935 – 17910 zone.
PVA High Edge = 18335 PVA Low Edge = 18290 Prior POC = 18303
Range Projections (NQ) March 2024 (H)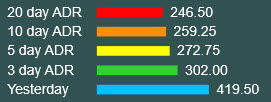
- BULL ATR Range Projection >>> 18226
- BEAR ATR Range Projection >>> 17710
Trade Strategy: Our tactical trade strategy will simply remain unaltered…We’ll be flexible to trade both long and short side from Decision Pivot Levels. Continue to focus on Bull/Bear Stackers and Premium/Discounts. As always, remaining in alignment with dominant intra-day force increases probabilities of producing winning trades.
Stay Focused…Non-Biased…Disciplined ALWAYS USE STOPS!
Good Trading…David
“Knowing is not enough, We must APPLY. Willing is not enough, We must DO.” –Bruce Lee
*****This trade strategy report is disseminated for “education only” and should not be viewed in any way as a recommendation to buy or sell futures products.”
PAST PERFORMANCE IS NOT NECESSARILY INDICATIVE OF FUTURE RESULTS
IMPORTANT NOTICE! No representation is being made that the use of this strategy or any system or trading methodology will generate profits. Past performance is not necessarily indicative of future results. There is substantial risk of loss associated with trading securities and options on equities. Only risk capital should be used to trade. Trading securities is not suitable for everyone.
Disclaimer: Futures, Options, and Currency trading all have large potential rewards, but they also have large potential risk. You must be aware of the risks and be willing to accept them in order to invest in these markets. Don’t trade with money you can’t afford to lose.
This website is neither a solicitation nor an offer to Buy/Sell futures, options, or currencies. No representation is being made that any account will or is likely to achieve profits or losses similar to those discussed on this web site. The past performance of any trading system or methodology is not necessarily indicative of future results.
CFTC RULE 4.41 –HYPOTHETICAL OR SIMULATED PERFORMANCE RESULTS HAVE CERTAIN LIMITATIONS. UNLIKE AN ACTUAL PERFORMANCE RECORD, SIMULATED RESULTS DO NOT REPRESENT ACTUAL TRADING. ALSO, SINCE THE TRADES HAVE NOT BEEN EXECUTED, THE RESULTS MAY HAVE UNDER-OR-OVER COMPENSATED FOR THE IMPACT, IF ANY, OF CERTAIN MARKET FACTORS, SUCH AS LACK OF LIQUIDITY. SIMULATED TRADING PROGRAMS IN GENERAL ARE ALSO SUBJECT TO THE FACT THAT THEY ARE DESIGNED WITH THE BENEFIT OF HINDSIGHT. NO REPRESENTATION IS BEING MADE THAT ANY ACCOUNT WILL OR IS LIKELY TO ACHIEVE PROFIT OR LOSSES SIMILAR TO THOSE SHOWN