
Markets
The Nasdaq is leading the charge on Wall Street this morning, with futures tied to the index ahead by 2.5%, followed by a 1.2% advance for the S&P 500 and 0.6% gain for the Dow. It marks some renewed momentum for tech shares, which have been beaten down in recent weeks as investors rotated into value sectors like energy, financials and industrials. In fact, the Nasdaq closed in correction territory on Monday, down 11% from an all-time high in February.

Source: SeekingAlpha.com
Economic Calendar
8:55 Redbook Chain Store Sales
1:00 PM Results of $58B, 3-Year Note Auction
***New: PTG Trading Room Chat Log’s Link
S&P 500

Prior Session was Cycle Day 1 (CD1): It was a “normal” CD1 as price declined, with CD1 Low (3796.25). Range was 82.50 handles on 2.139M contracts exchanged.
…Transition from Cycle Day 1 to Cycle Day 2
This leads us into Cycle Day 2 (CD2): Price is currently trading within prior value zone (3838 – 3876) and near POC (3860) as well as 3 Day Cycle Objective being fulfilled (3856). Normal for CD2 is some back n fill consolidation to absorb recent wide swing volatility. As such, there are two estimated scenarios to consider for today’s trading.
1.) Price sustains a bid above 3860, initially targets 3875 – 3880 zone.
2.) Price sustains an offer below 3860, initially targets 3845 – 3840 zone.
*****3 Day Cycle has a 91% probability of fulfilling Positive Statistic covering 12 years of recorded tracking history.
PVA High Edge = 3878 PVA Low Edge = 3838 Prior POC = 3860
Range Projections and Key Levels (ES) March 2021 (H) Contract
HOD ATR Range Projection: 3911; LOD ATR Range Projection: 3780; 3 Day Central Pivot: 3805; 3 Day Cycle Target: 3856; 10 Day Average True Range 85; VIX: 25

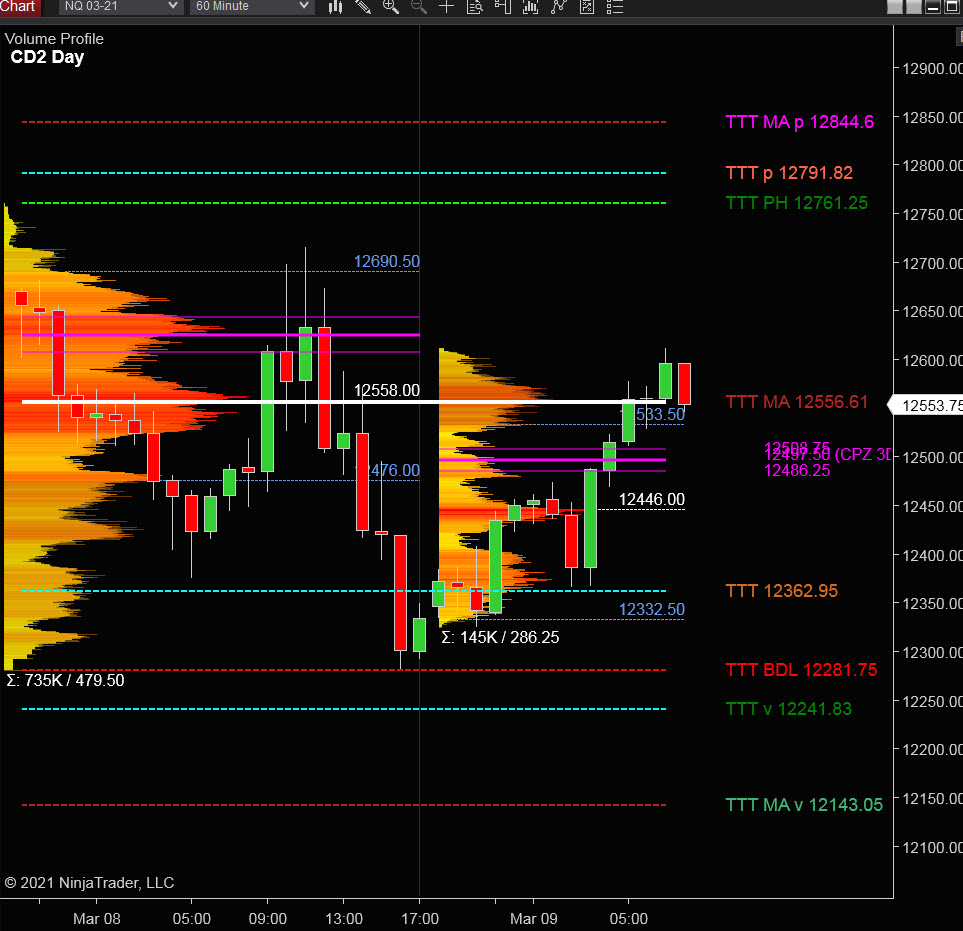
Nasdaq 100 (NQ)

Today is Cycle Day 2 (CD2)…Price is currently trading within prior Value Zone as well as 3 Day Cycle Objective being fulfilled (12556). Prior Range was 479.50 handles on 735k contracts exchanged. As such, there are two estimated scenarios to consider for today’s trading.
PVA High Edge = 12690 PVA Low Edge = 12475 Prior POC = 12550
Bull Scenario: IF Bulls sustain a bid above 12550, THEN initial upside estimate targets 12625 – 12650 zone.
Bear Scenario: IF Bears sustain an offer below 12550, THEN initial downside estimate targets 12480 – 12450 zone.
Range Projections and Key Levels (NQ) March 2021 (H) Contract
HOD ATR Range Projection: 12743; LOD ATR Range Projection: 12195; 3 Day Central Pivot: 12500; 3 Day Cycle Target: 12556; 10 Day Average True Range: 417; VIX: 25
Trade Strategy: Our tactical trade strategy will simply remain unaltered…We’ll be flexible to trade both long and short side from Decision Pivot Levels. Continue to focus on Bull/Bear Stackers and Premium/Discounts. As always, remaining in alignment with dominant intra-day force increases probabilities of producing winning trades.
Stay Focused…Non-Biased…Disciplined ALWAYS USE STOPS!
Good Trading…David
“Knowing is not enough, We must APPLY. Willing is not enough, We must DO.” –Bruce Lee
*****This trade strategy report is disseminated for “education only” and should not be viewed in any way as a recommendation to buy or sell futures products.”
PAST PERFORMANCE IS NOT NECESSARILY INDICATIVE OF FUTURE RESULTS
IMPORTANT NOTICE! No representation is being made that the use of this strategy or any system or trading methodology will generate profits. Past performance is not necessarily indicative of future results. There is substantial risk of loss associated with trading securities and options on equities. Only risk capital should be used to trade. Trading securities is not suitable for everyone.
Disclaimer: Futures, Options, and Currency trading all have large potential rewards, but they also have large potential risk. You must be aware of the risks and be willing to accept them in order to invest in these markets. Don’t trade with money you can’t afford to lose.
This website is neither a solicitation nor an offer to Buy/Sell futures, options, or currencies. No representation is being made that any account will or is likely to achieve profits or losses similar to those discussed on this web site. The past performance of any trading system or methodology is not necessarily indicative of future results.
CFTC RULE 4.41 –HYPOTHETICAL OR SIMULATED PERFORMANCE RESULTS HAVE CERTAIN LIMITATIONS. UNLIKE AN ACTUAL PERFORMANCE RECORD, SIMULATED RESULTS DO NOT REPRESENT ACTUAL TRADING. ALSO, SINCE THE TRADES HAVE NOT BEEN EXECUTED, THE RESULTS MAY HAVE UNDER-OR-OVER COMPENSATED FOR THE IMPACT, IF ANY, OF CERTAIN MARKET FACTORS, SUCH AS LACK OF LIQUIDITY. SIMULATED TRADING PROGRAMS IN GENERAL ARE ALSO SUBJECT TO THE FACT THAT THEY ARE DESIGNED WITH THE BENEFIT OF HINDSIGHT. NO REPRESENTATION IS BEING MADE THAT ANY ACCOUNT WILL OR IS LIKELY TO ACHIEVE PROFIT OR LOSSES SIMILAR TO THOSE SHOWN