
Markets (Top Stories)
 The closely-watched Consumer Price Index is seen easing further in March, but not nearly enough to meet the Federal Reserve’s price stability mandate. The inflation data due later today will offer a signal as to whether the Fed will raise rates or pause hikes in May – one of the biggest debates on Wall Street. Economists expect March’s headline CPI to rise 0.2% sequentially, lower than the 0.4% pace recorded in February. On a year-over-year basis, headline inflation is expected to climb 5.2%, compared with 6% in February. Stripping out the volatile food and energy sectors, core CPI is expected to advance 0.4% M/M vs. the 0.5% February reading, and 5.6% Y/Y vs. 5.5% in February.
Source: SeekingAlpha.com
Economic Calendar
8:30 Consumer Price Index
9:10 Fed’s Barkin Speech
10:00 Atlanta Fed’s Business Inflation Expectations
1:00 PM Results of $32B, 10-Year Note Auction
2:00 PM FOMC Minutes
2:00 PM Treasury Statement
https://www.investing.com/economic-calendar/
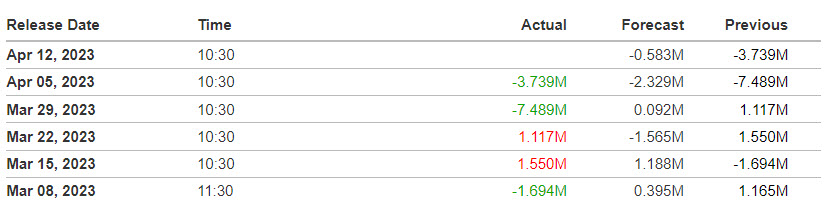
 10:30 EIA Petroleum Inventories
S&P 500

***Written Tuesday evening for Wednesday’s trading for contribution to MrTopStep’s “The Opening Print” publication.
Prior Session was Cycle Day 2 (CD2): Normal CD2 as price successfully tested key LIS (4130), rallied fulfilling 4150 target, then liquidation break returned price back down to the 4138 closing level. Prior range was 23 handles on 1.180M contracts exchanged.
…Transition from Cycle Day 2 to Cycle Day 3
This leads us into Cycle Day 3 (CD3): Today is the BIG CPI print and as such, trade activity is quiet ahead of the release. We’ll mark today at a “wild-card” for direction, as price has been range bound this week keeping LIS at 4130. As such, scenarios to consider for today’s trading.
Bull Scenario: Price sustains a bid above 4130, initially targets 4150 – 4155 zone.
Bear Scenario: Price sustains an offer below 4130, initially targets 4115 – 4110 zone.
PVA High Edge = 4143 PVA Low Edge = 4133 Prior POC = 4140
*****The 3 Day Cycle has a 91% probability of fulfilling Positive Cycle Statistics covering 12 years of recorded tracking history.
For more detailed information for both bullish and bearish projected targets, please visit: PTG 3 Day Cycle and/or reference the Cycle Spreadsheet below:
Link to access full Cycle Spreadsheet > > Cycle Day 3 (CD3)
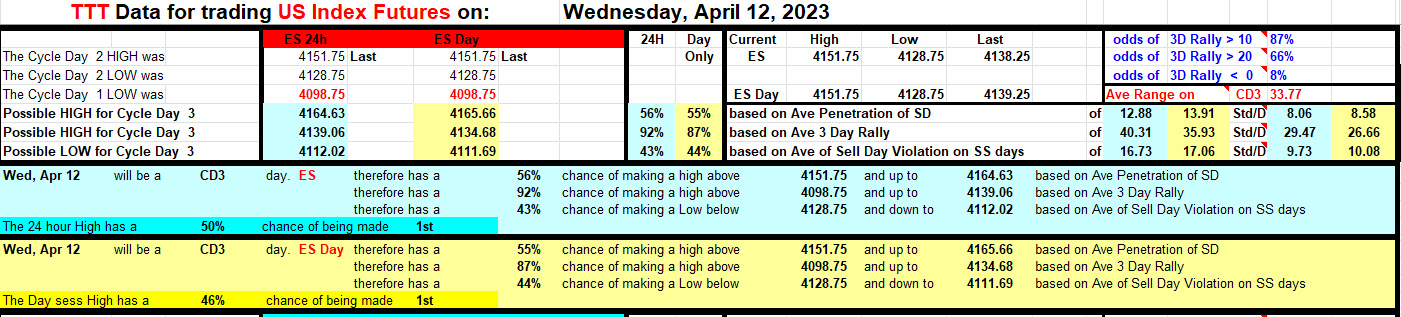
Range Projections and Key Levels (ES) June 2023 (M) Contract
HOD ATR Range Projection: 4175; LOD ATR Range Projection: 4105; 3 Day Central Pivot: 4134; 3 Day Cycle Target: 4163; 10 Day Average True Range 42; VIX: 19

Nasdaq 100 (NQ)

Prior Session was Cycle Day 2 (CD2): Normal CD2 as price held bid throughout the session until late day liquidation break that erased all the gains. Prior range was 155 handles on 544k contracts exchanged.
…Transition from Cycle Day 2 to Cycle Day 3
This leads us into Cycle Day 3 (CD3): Today is the BIG CPI print and as such, trade activity is quiet. We’ll mark today at a “wild-card” for direction, as price has been range bound this week. As such, scenarios to consider for today’s trading.
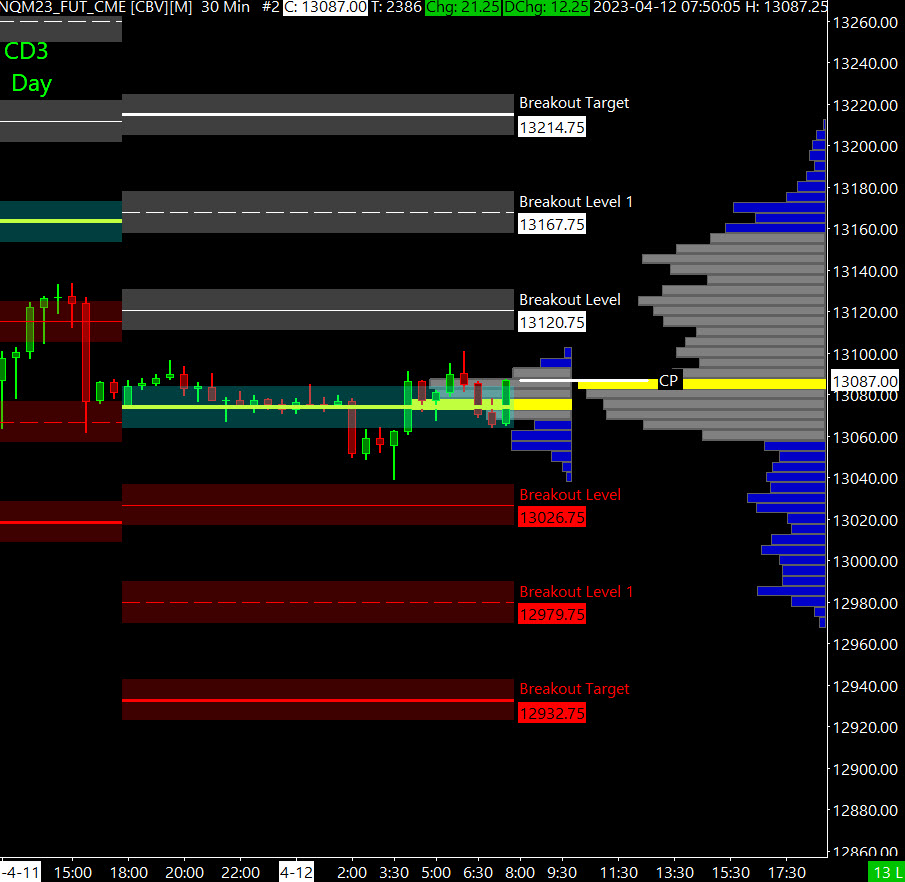
Bull Scenario: Price sustains a bid above 13050, initially targets 13160 – 13180 zone.
Bear Scenario: Price sustains an offer below 13050, initially targets 12950 – 12920 zone.
PVA High Edge = 13123 PVA Low Edge = 13063 Prior POC = 13083
Range Projections and Key Levels (NQ) June 2023 (M) Contract
HOD ATR Range Projection: 13235; LOD ATR Range Projection: 12904; 3 Day Central Pivot: 13131; 3 Day Cycle Target: 13215; 10 Day Average True Range: 196; VIX: 19
Trade Strategy: Our tactical trade strategy will simply remain unaltered…We’ll be flexible to trade both long and short side from Decision Pivot Levels. Continue to focus on Bull/Bear Stackers and Premium/Discounts. As always, remaining in alignment with dominant intra-day force increases probabilities of producing winning trades.
Stay Focused…Non-Biased…Disciplined ALWAYS USE STOPS!
Good Trading…David
“Knowing is not enough, We must APPLY. Willing is not enough, We must DO.” –Bruce Lee
*****This trade strategy report is disseminated for “education only” and should not be viewed in any way as a recommendation to buy or sell futures products.”
PAST PERFORMANCE IS NOT NECESSARILY INDICATIVE OF FUTURE RESULTS
IMPORTANT NOTICE! No representation is being made that the use of this strategy or any system or trading methodology will generate profits. Past performance is not necessarily indicative of future results. There is substantial risk of loss associated with trading securities and options on equities. Only risk capital should be used to trade. Trading securities is not suitable for everyone.
Disclaimer: Futures, Options, and Currency trading all have large potential rewards, but they also have large potential risk. You must be aware of the risks and be willing to accept them in order to invest in these markets. Don’t trade with money you can’t afford to lose.
This website is neither a solicitation nor an offer to Buy/Sell futures, options, or currencies. No representation is being made that any account will or is likely to achieve profits or losses similar to those discussed on this web site. The past performance of any trading system or methodology is not necessarily indicative of future results.
CFTC RULE 4.41 –HYPOTHETICAL OR SIMULATED PERFORMANCE RESULTS HAVE CERTAIN LIMITATIONS. UNLIKE AN ACTUAL PERFORMANCE RECORD, SIMULATED RESULTS DO NOT REPRESENT ACTUAL TRADING. ALSO, SINCE THE TRADES HAVE NOT BEEN EXECUTED, THE RESULTS MAY HAVE UNDER-OR-OVER COMPENSATED FOR THE IMPACT, IF ANY, OF CERTAIN MARKET FACTORS, SUCH AS LACK OF LIQUIDITY. SIMULATED TRADING PROGRAMS IN GENERAL ARE ALSO SUBJECT TO THE FACT THAT THEY ARE DESIGNED WITH THE BENEFIT OF HINDSIGHT. NO REPRESENTATION IS BEING MADE THAT ANY ACCOUNT WILL OR IS LIKELY TO ACHIEVE PROFIT OR LOSSES SIMILAR TO THOSE SHOWN