
Markets
U.S. stock futures are in negative territory pre-RTH
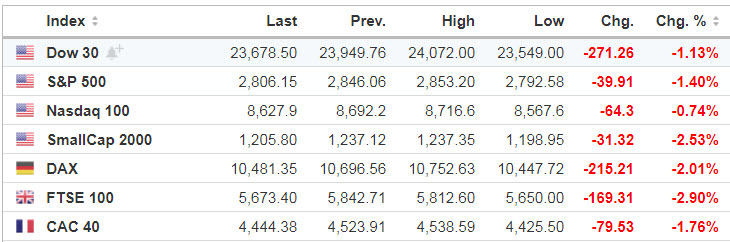
Source: Seeking Alpha https://seekingalpha.com/

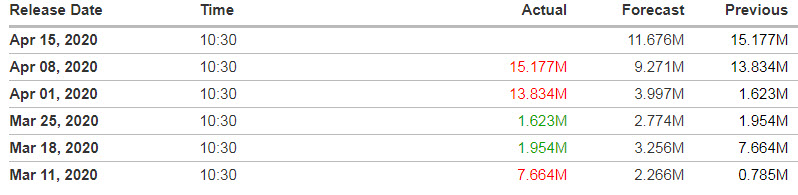
Source: https://www.investing.com/economic-calendar/eia-crude-oil-inventories-75
Economic Calendar https://www.investing.com/economic-calendar/
8:30 Retail Sales
8:30 Empire State Mfg Survey
9:15 Industrial Production
10:00 Business Inventories
10:00 NAHB Housing Market Index
10:00 Atlanta Fed’s Business Inflation Expectations
10:30 EIA Petroleum Inventories
1:00 PM Fed’s Bostic: Economic Outlook
2:00 PM Fed’s Beige Book
We’ll keep the “High Surf Warning” posted for the foreseeable future.

S&P 500
Tuesday’s Session was Cycle Day 3 (CD3): Bullish Gap vaulted price above CD2 RTH High (2770) and traded above CD1 RTH High (2809). Bid held strong all session fulfilling and exceeding this Cycle’s Objectives. Price has firmly retraced +50% of the February – March peak-to-trough decline. Current momentum squarely favoring bulls as 10 ema (2682) is solidly up-sloping. Notwithstanding possible air-pockets of downside turbulence, so be sure to keep your seatbelts securely fastened.
…Transition from Cycle Day 3 to Cycle Day 1
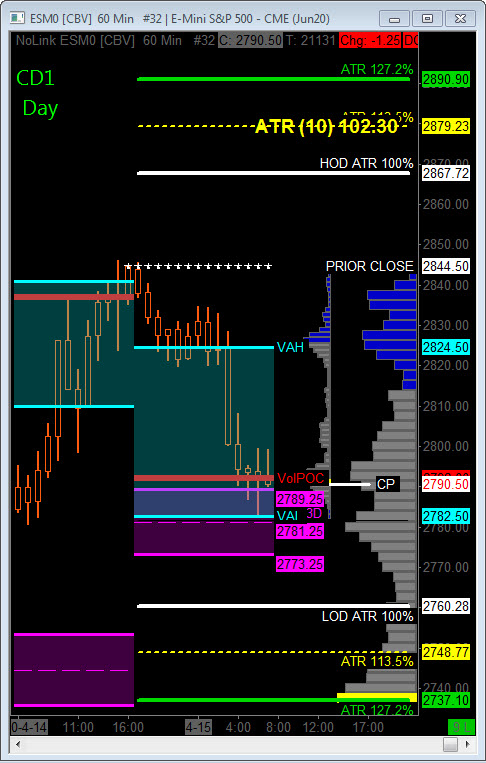
This leads us into Cycle Day 1 (CD1): Objective for this cycle day is to “probe for a new secure low” from which to begin the next cycle’s rally.
Price failed to extend prior gains above previous CD3 high and as such, this cycle’s decline has begun. Currently price has found initial support within 3 Day Central Pivot Zone (2789 – 2781). IF this zone is violated and converted to lower resistance, THEN CD1 Average Decline measures 2740 – 2734 zone.
P-VA High = 2840 P-VA Low = 2810 P-POC = 2836
Bull Scenario: IF Bulls hold bid above 2790, THEN initial upside estimate targets 2810 – 2820 zone
Bear Scenario: IF Bears hold offer below 2790, THEN initial downside estimate targets 2780 – 2770 zone.
Range Projections and Key Levels (ES) June 2020 (M) Contract
HOD ATR Range Projection: 2868; LOD ATR Range Projection: 2760; 3 Day Central Pivot: 2780; 3 Day Cycle Target: 2856; 10 Day Average True Range 102; VIX: 41.00
Nasdaq 100 (NQ)
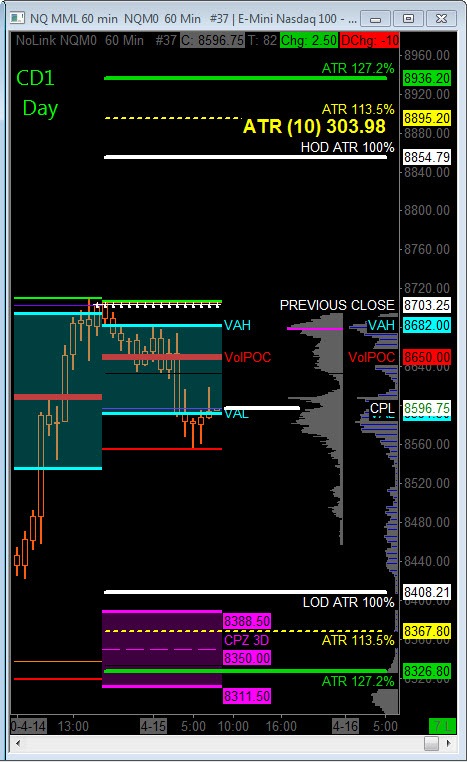
Today is Cycle Day 1 (CD1)…Price failed to extend prior gains above previous CD3 high and as such, this cycle’s decline has begun. Currently price has found initial support within prior Value Zone. IF this zone is violated and converted to lower resistance, THEN CD1 Average Decline measures 8282 handle.
P-VA High = 8695 P-VA Low = 8535 P-POC = 8608
Bull Scenario: IF Bulls hold bid above 8610, THEN initial upside estimate targets 8640 – 8660 zone.
Bear Scenario: IF Bears hold offer below 8610, THEN initial downside estimate targets 8555 – 8535 zone.
Range Projections and Key Levels (NQ) June 2020 (M) Contract
HOD ATR Range Projection: 8855; LOD ATR Range Projection: 8408; 3 Day Central Pivot: 8350; 3 Day Cycle Target: 8816; 10 Day Average True Range: 304; VIX: 41.00
Trade Strategy: Our tactical trade strategy will simply remain unaltered…We’ll be flexible to trade both long and short side from Decision Pivot Levels. Continue to focus on Bull/Bear Stackers and Premium/Discounts. As always, remaining in alignment with dominant intra-day force increases probabilities of producing winning trades.
Stay Focused…Non-Biased…Disciplined ALWAYS USE STOPS!
Good Trading…David
“Knowing is not enough, We must APPLY. Willing is not enough, We must DO.” –Bruce Lee
*****This trade strategy report is disseminated for “education only” and should not be viewed in any way as a recommendation to buy or sell futures products.”
PAST PERFORMANCE IS NOT NECESSARILY INDICATIVE OF FUTURE RESULTS
IMPORTANT NOTICE! No representation is being made that the use of this strategy or any system or trading methodology will generate profits. Past performance is not necessarily indicative of future results. There is substantial risk of loss associated with trading securities and options on equities. Only risk capital should be used to trade. Trading securities is not suitable for everyone.
Disclaimer: Futures, Options, and Currency trading all have large potential rewards, but they also have large potential risk. You must be aware of the risks and be willing to accept them in order to invest in these markets. Don’t trade with money you can’t afford to lose.
This website is neither a solicitation nor an offer to Buy/Sell futures, options, or currencies. No representation is being made that any account will or is likely to achieve profits or losses similar to those discussed on this web site. The past performance of any trading system or methodology is not necessarily indicative of future results.
CFTC RULE 4.41 –HYPOTHETICAL OR SIMULATED PERFORMANCE RESULTS HAVE CERTAIN LIMITATIONS. UNLIKE AN ACTUAL PERFORMANCE RECORD, SIMULATED RESULTS DO NOT REPRESENT ACTUAL TRADING. ALSO, SINCE THE TRADES HAVE NOT BEEN EXECUTED, THE RESULTS MAY HAVE UNDER-OR-OVER COMPENSATED FOR THE IMPACT, IF ANY, OF CERTAIN MARKET FACTORS, SUCH AS LACK OF LIQUIDITY. SIMULATED TRADING PROGRAMS IN GENERAL ARE ALSO SUBJECT TO THE FACT THAT THEY ARE DESIGNED WITH THE BENEFIT OF HINDSIGHT. NO REPRESENTATION IS BEING MADE THAT ANY ACCOUNT WILL OR IS LIKELY TO ACHIEVE PROFIT OR LOSSES SIMILAR TO THOSE SHOWN