
Markets
U.S. stock index futures are losing a bit more ground as investors look to the continuing first-quarter earnings season for clues about the strength of businesses and the economy. Dow futures are down 53 points, while S&P 500 and Nasdaq futures are 0.1% lower ahead of the open.
In Asia, Japan -0.8%. Hong Kong -0.5%. China -0.4%. India -0.3%.
In Europe, at midday, London -0.2%. Paris +0.2%. Frankfurt +0.4%.
Futures at 6:20, Dow -0.2%. S&P -0.1%. Nasdaq -0.1%. Crude -0.1% to $63.81. Gold flat at $1277. Bitcoin +0.5% to $5241.
Ten-year Treasury Yield -3 bps to 2.56%
Source: Seeking Alpha
8:30Initial Jobless Claims
8:30Philly Fed Business Outlook
8:30Retail Sales
9:45PMI Composite Flash
10:00Business Inventories
10:00Leading Indicators
10:30EIA Natural Gas Inventory
4:30 PMMoney Supply
4:30 PMFed Balance Sheet
***New: PTG Trading Room Chat Log’s Link
S&P 500
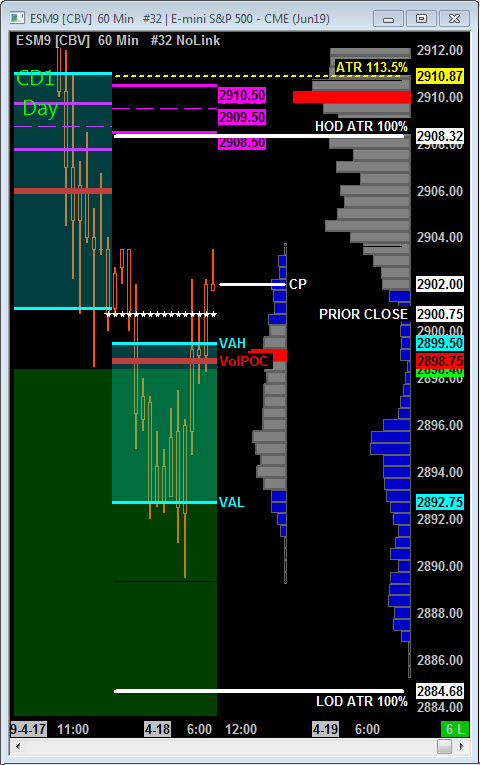
Today is Cycle Day 1 (CD1)…Normal is for a decline measuring 2897.00 (FULFILLED). Average Range for CD1 is 24.25 handles. Odds of decline > 10 handles = 72% Odds of decline > 20 = 43%
As Richard Boisvert, provider of the 3 Day Taylor Cycle Metrics noted in tweet: Cycle Day 3 (Sell Short) was a (paraphrased) ‘Text Book SS Day. Markets tried but failed to penetrate (convert) the Cycle Day 2 (Sell Day) High…Then the Decline started’
CD1 Range High = 2913.00 CD1 Range Low = 2880.00 CD1 Range Avg = 24.25
Scenario 1: IF Bulls hold bid above 2900, THEN initial upside targets 2908.50 – 2910.50 3 Day Central Pivot Zone.
Scenario 2: IF Bears hold offer below 2900, THEN initial downside targets 2886.25 – 2884.00 Average Violation Zone.
Range Projections and Key Levels (ES) June 2019 (M) Contract
HOD ATR Range Projection: 2908.50; LOD ATR Range Projection: 2884.50; 3 Day Central Pivot: 2909.50 3 Day Cycle Target: 2917.50; 10 Day Average True Range 19.00; VIX: 12.60
Nasdaq 100 (NQ)
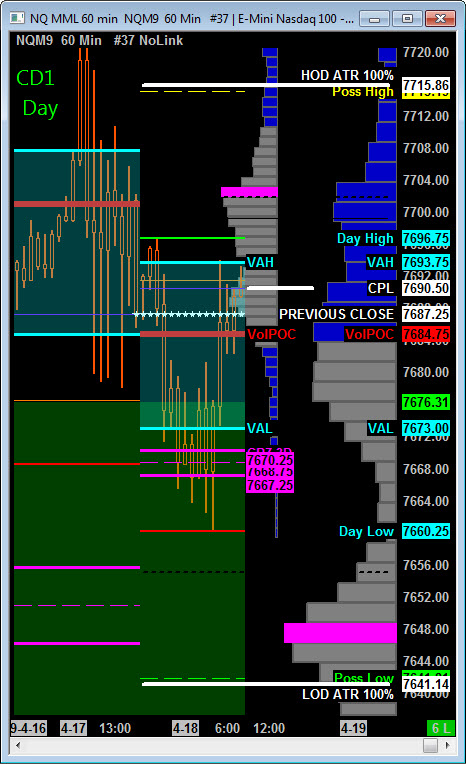
Today is Cycle Day 1 (CD1)…Normal is for a decline measuring 7652.50. Average Range for CD1 is 77.50 handles. Odds of decline > 20 handles = 74% Odds of decline > 25 = 65%
CD1 Range High =7715.00 CD1 Range Low = 7641.00 CD1 Range Avg = 77.50
Scenario 1: IF Bulls hold bid above 7687.00, THEN initial upside targets 7701 – 7708 zone.
Scenario 2: IF Bears hold offer below 7687.00, THEN initial downside targets 7673 – 7667.25 3 Day Central Pivot Zone.
Range Projections and Key Levels (NQ) June 2019 (M) Contract
HOD ATR Range Projection: 7716.00; LOD ATR Range Projection: 7641.00; 3 Day Central Pivot: 7667.00; 3 Day Cycle Target: 7728.50; 10 Day Average True Range: 55.50; VIX: 12.60
Trade Strategy: Our tactical trade strategy will simply remain unaltered…We’ll be flexible to trade both long and short side from Decision Pivot Levels. Continue to focus on Bull/Bear Stackers and Premium/Discounts. As always, remaining in alignment with dominant intra-day force increases probabilities of producing winning trades.
Stay Focused…Non-Biased…Disciplined ALWAYS USE STOPS!
Good Trading…David
“Knowing is not enough, We must APPLY. Willing is not enough, We must DO.” –Bruce Lee
*****This trade strategy report is disseminated for “education only” and should not be viewed in any way as a recommendation to buy or sell futures products.”
PAST PERFORMANCE IS NOT NECESSARILY INDICATIVE OF FUTURE RESULTS
IMPORTANT NOTICE! No representation is being made that the use of this strategy or any system or trading methodology will generate profits. Past performance is not necessarily indicative of future results. There is substantial risk of loss associated with trading securities and options on equities. Only risk capital should be used to trade. Trading securities is not suitable for everyone.
Disclaimer: Futures, Options, and Currency trading all have large potential rewards, but they also have large potential risk. You must be aware of the risks and be willing to accept them in order to invest in these markets. Don’t trade with money you can’t afford to lose.
This website is neither a solicitation nor an offer to Buy/Sell futures, options, or currencies. No representation is being made that any account will or is likely to achieve profits or losses similar to those discussed on this web site. The past performance of any trading system or methodology is not necessarily indicative of future results.
CFTC RULE 4.41 –HYPOTHETICAL OR SIMULATED PERFORMANCE RESULTS HAVE CERTAIN LIMITATIONS. UNLIKE AN ACTUAL PERFORMANCE RECORD, SIMULATED RESULTS DO NOT REPRESENT ACTUAL TRADING. ALSO, SINCE THE TRADES HAVE NOT BEEN EXECUTED, THE RESULTS MAY HAVE UNDER-OR-OVER COMPENSATED FOR THE IMPACT, IF ANY, OF CERTAIN MARKET FACTORS, SUCH AS LACK OF LIQUIDITY. SIMULATED TRADING PROGRAMS IN GENERAL ARE ALSO SUBJECT TO THE FACT THAT THEY ARE DESIGNED WITH THE BENEFIT OF HINDSIGHT. NO REPRESENTATION IS BEING MADE THAT ANY ACCOUNT WILL OR IS LIKELY TO ACHIEVE PROFIT OR LOSSES SIMILAR TO THOSE SHOWN