
Markets
U.S. stock futures are marginally lower as investors await official domestic GDP data and another batch of corporate earnings to wrap up the week. Economists surveyed by The Wall Street Journal estimate GDP rose at a 2.5% annual rate for the quarter, which would mark the economy’s strongest January-March performance in four years.
In Asia, Japan -0.22%. Hong Kong +0.19%. China -1.20%. India +0.97%.
In Europe, at midday, London -0.26%. Paris flat. Frankfurt +0.09%.
Futures at 6:20, Dow -0.13%. S&P -0.09%. Nasdaq +0.11%. Crude -1.86% to $64. Gold +0.25%to $1,282.90. Bitcoin -1.5% to $5380.
Ten-year Treasury Yield -1.2bps to 2.522%
(Source: Seeking Alpha)
Economic Calendar
8:30GDP Q1
10:00Consumer Sentiment
1:00 PMBaker-Hughes Rig Count
*****New PTG Trading Room Chat Log’s Link
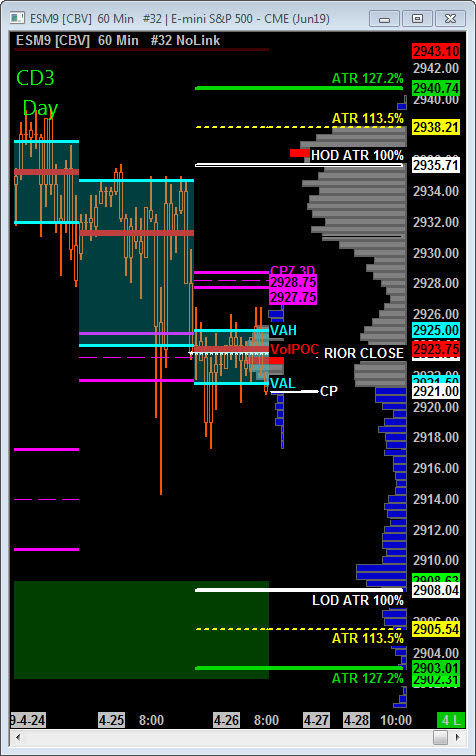
S&P 500
Today is Cycle Day 3 …Price is currently trading beneath the Cycle Day 1 Low (2927.75) and will need to tic above this level to fulfill Positive 3 Day Cycle Statistic. Overhead resistance is marked at 2935 handle with 2915 marked as lower support.
CD3 Range High = 2940.00 CD3 Range Low = 2904.00 CD3 Range Avg = 28.00
Scenario 1: IF Bulls hold bid above 2924, THEN initial upside target measures 2928 – 2931 zone. Next higher target measures 2934 – 2936 zone.
Scenario 2: IF Bears hold offer below 2924, THEN initial downside target measures 2914 – 2904.00 zone.
Range Projections and Key Levels (ES) June (M) Contract
HOD ATR Range Projection: 2936.00; LOD ATR Range Projection: 2908.00; Cycle Day 1 Low: 2927.75; 3 Day Central Pivot: 2928.00; 3 Day Cycle Target: 2956.00; 10 Day Average True Range 18.50; VIX: 13.50
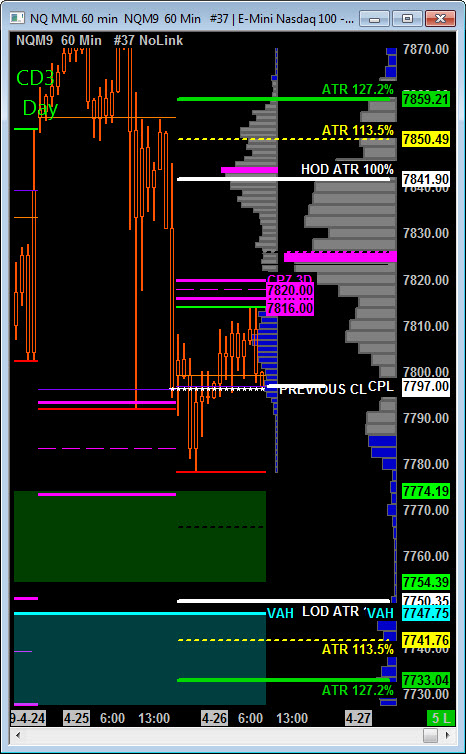
Nasdaq 100 (NQ)
Today is Cycle Day 3…Positive 3 Day Cycle has been fulfilled with the NAZ as technology company earnings continue to have a whip-sawing effect on this future. Price action is appearing a bit more “toppy” with 60 minute H&S Pattern developing. Today is a”wild-card” for direction.
CD3 Range High = 7835.00 CD3 Range Low = 7757.00 CD3 Range Avg = 86.00
Scenario 1: IF Bulls hold bid above 7796, THEN initial upside potential targets 7816 – 7820 3 Day Central Pivot Zone. Conversion of this zone opens skylight targeting 7835 – 7842 upper CD3 Range Zone.
Scenario 2: IF Bears hold offer below 7796, THEN initial downside targets 7757 – 7750 lower CD3 Range Zone.
Range Projections and Key Levels (NQ) June (M) Contract
HOD ATR Range Projection: 7842.00; LOD ATR Range Projection: 7750.00; Cycle Day 1 Low: 7660.25; 3 Day Central Pivot: 7802.25; 3 Day Cycle Target: 7871.00; 10 Day Average True Range: 63.50; VIX: 13.50
Trade Strategy: Our tactical trade strategy will simply remain unaltered…We’ll be flexible to trade both long and short side from Decision Pivot Levels. Continue to focus on Bull/Bear Stackers and Premium/Discounts. As always, remaining in alignment with dominant intra-day force increases probabilities of producing winning trades.
Stay Focused…Non-Biased…Disciplined ALWAYS USE STOPS!
Good Trading…David
“Knowing is not enough, We must APPLY. Willing is not enough, We must DO.” –Bruce Lee
*****This trade strategy report is disseminated for “education only” and should not be viewed in any way as a recommendation to buy or sell futures products.”
PAST PERFORMANCE IS NOT NECESSARILY INDICATIVE OF FUTURE RESULTS
IMPORTANT NOTICE! No representation is being made that the use of this strategy or any system or trading methodology will generate profits. Past performance is not necessarily indicative of future results. There is substantial risk of loss associated with trading securities and options on equities. Only risk capital should be used to trade. Trading securities is not suitable for everyone.
Disclaimer: Futures, Options, and Currency trading all have large potential rewards, but they also have large potential risk. You must be aware of the risks and be willing to accept them in order to invest in these markets. Don’t trade with money you can’t afford to lose.
This website is neither a solicitation nor an offer to Buy/Sell futures, options, or currencies. No representation is being made that any account will or is likely to achieve profits or losses similar to those discussed on this web site. The past performance of any trading system or methodology is not necessarily indicative of future results.
CFTC RULE 4.41 –HYPOTHETICAL OR SIMULATED PERFORMANCE RESULTS HAVE CERTAIN LIMITATIONS. UNLIKE AN ACTUAL PERFORMANCE RECORD, SIMULATED RESULTS DO NOT REPRESENT ACTUAL TRADING. ALSO, SINCE THE TRADES HAVE NOT BEEN EXECUTED, THE RESULTS MAY HAVE UNDER-OR-OVER COMPENSATED FOR THE IMPACT, IF ANY, OF CERTAIN MARKET FACTORS, SUCH AS LACK OF LIQUIDITY. SIMULATED TRADING PROGRAMS IN GENERAL ARE ALSO SUBJECT TO THE FACT THAT THEY ARE DESIGNED WITH THE BENEFIT OF HINDSIGHT. NO REPRESENTATION IS BEING MADE THAT ANY ACCOUNT WILL OR IS LIKELY TO ACHIEVE PROFIT OR LOSSES SIMILAR TO THOSE SHOWN