
Markets (Top Stories)
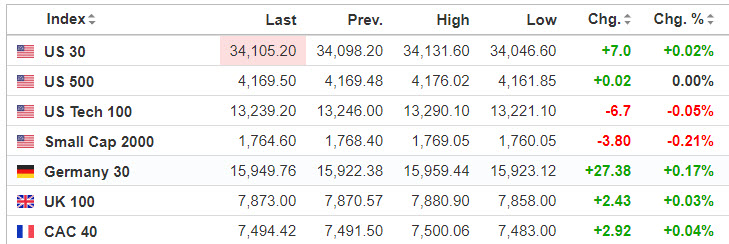
Source: Investing.com
Economic Calendar

https://www.investing.com/economic-calendar/
S&P 500

Prior Session was Cycle Day 3 (CD3): Markets closed out April in spectacular fashion by rallying to close on highs. Prior range was 62 handles on 1.687M contracts exchanged.
…Transition from Cycle Day 3 to Cycle Day 1
This leads us into Cycle Day 1 (CD1): Average Decline for CD1 measures 4160. There is room for the rally to continue, though we are anticipating more of a MATD given the strong directional rally to close out last month. It is also Mutual Fund Monday (MFM), whereby new monies are put to work. Of course anything and everything is possible, hence just follow the core PTG Trade Plan. As such, estimated scenarios to consider for today’s trading.
Bull Scenario: Price sustains a bid above 4190, initially targets 4205 – 4210 zone.
Bear Scenario: Price sustains an offer below 4190, initially targets 4175 – 4170 zone.
PVA High Edge = 4192 PVA Low Edge = 4165 Prior POC 4180
Range Projections and Key Levels (ES) June 2023 (M) Contract
HOD ATR Range Projection: 4227; LOD ATR Range Projection: 4149; 3 Day Central Pivot: 4132; 3 Day Cycle Target: 4215; 10 Day Average True Range 47; VIX: 16

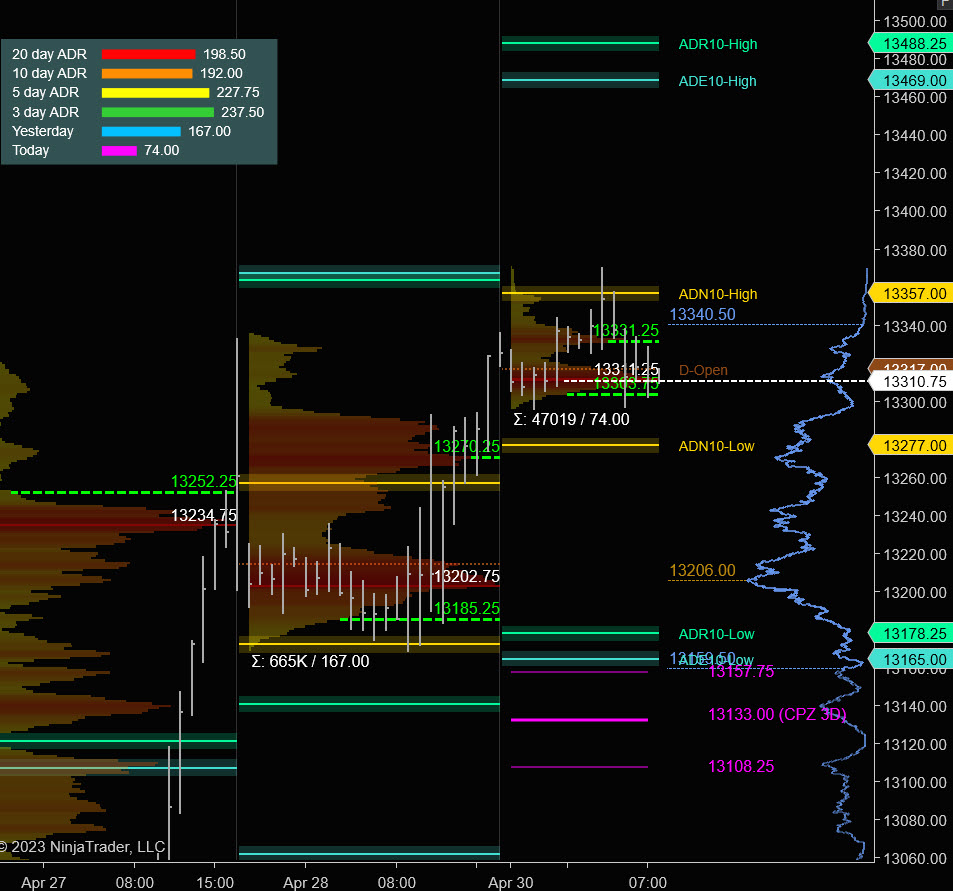
Nasdaq 100 (NQ)

Prior Session was Cycle Day 3 (CD3): Markets closed out April in spectacular fashion by rallying to close on highs. Prior range was 167 handles on 665k contracts exchanged.
…Transition from Cycle Day 3 to Cycle Day 1
This leads us into Cycle Day 1 (CD1): Average Decline for CD1 measures 13226. There is room for the rally to continue, though we are anticipating more of a MATD given the strong directional rally to close out last month. It is also Mutual Fund Monday (MFM), whereby new monies are put to work. Of course anything and everything is possible, hence just follow the core PTG Trade Plan. As such, estimated scenarios to consider for today’s trading.
Bull Scenario: IF Bulls sustains bid above 13320, THEN initial upside estimate targets 13370– 13380 zone.
Bear Scenario: IF Bears sustains offer below 13320, THEN initial downside estimate targets 13270 – 13250 zone.
PVA High Edge = 13270 PVA Low Edge = 13185 Prior POC = 13203
Range Projections and Key Levels (NQ) June 2022 (M) Contract
HOD ATR Range Projection: 13196; LOD ATR Range Projection: 12917; 3 Day Central Pivot: 13146; 3 Day Cycle Target: 13215; 10 Day Average True Range: 190; VIX: 17
Trade Strategy: Our tactical trade strategy will simply remain unaltered…We’ll be flexible to trade both long and short side from Decision Pivot Levels. Continue to focus on Bull/Bear Stackers and Premium/Discounts. As always, remaining in alignment with dominant intra-day force increases probabilities of producing winning trades.
Stay Focused…Non-Biased…Disciplined ALWAYS USE STOPS!
Good Trading…David
“Knowing is not enough, We must APPLY. Willing is not enough, We must DO.” –Bruce Lee
*****This trade strategy report is disseminated for “education only” and should not be viewed in any way as a recommendation to buy or sell futures products.”
PAST PERFORMANCE IS NOT NECESSARILY INDICATIVE OF FUTURE RESULTS
IMPORTANT NOTICE! No representation is being made that the use of this strategy or any system or trading methodology will generate profits. Past performance is not necessarily indicative of future results. There is substantial risk of loss associated with trading securities and options on equities. Only risk capital should be used to trade. Trading securities is not suitable for everyone.
Disclaimer: Futures, Options, and Currency trading all have large potential rewards, but they also have large potential risk. You must be aware of the risks and be willing to accept them in order to invest in these markets. Don’t trade with money you can’t afford to lose.
This website is neither a solicitation nor an offer to Buy/Sell futures, options, or currencies. No representation is being made that any account will or is likely to achieve profits or losses similar to those discussed on this web site. The past performance of any trading system or methodology is not necessarily indicative of future results.
CFTC RULE 4.41 –HYPOTHETICAL OR SIMULATED PERFORMANCE RESULTS HAVE CERTAIN LIMITATIONS. UNLIKE AN ACTUAL PERFORMANCE RECORD, SIMULATED RESULTS DO NOT REPRESENT ACTUAL TRADING. ALSO, SINCE THE TRADES HAVE NOT BEEN EXECUTED, THE RESULTS MAY HAVE UNDER-OR-OVER COMPENSATED FOR THE IMPACT, IF ANY, OF CERTAIN MARKET FACTORS, SUCH AS LACK OF LIQUIDITY. SIMULATED TRADING PROGRAMS IN GENERAL ARE ALSO SUBJECT TO THE FACT THAT THEY ARE DESIGNED WITH THE BENEFIT OF HINDSIGHT. NO REPRESENTATION IS BEING MADE THAT ANY ACCOUNT WILL OR IS LIKELY TO ACHIEVE PROFIT OR LOSSES SIMILAR TO THOSE SHOWN